

In part 1of our commentary, we discussed the current Fundamental Gravity of our “U.S. Shift Work” macro theme. If you missed part 1, I would encourage you to read through that first, before jumping into part 2 here, says Landon Whaley Friday.
We covered a great deal of critical fundamental developments, which are bullishly impacting U.S. REITs and the US-listed ETF, Vanguard Real Estate Index ETF (VNQ).
Quantitative Gravity says what?
As a quick reminder, the Quantitative Gravity component of our Gravitational Framework is not technical analysis, which is ineffective and misleading. Rather, we use quantitative measures based on the reality that financial markets are a nonlinear, chaotic system. We’ve identified four primary quantitative dimensions of financial markets that affect price movement: energy (trend), force (momentum), rate of force (buying pressure), and a market’s irregularity (level of imminent drawdown risk).
Social is our measure of a market’s current energy (or trend). VNQ’s Social reading indicates it is currently asleep. The fact that VNQ is currently trendless isn’t surprising given the run it went on from April to September. Given the underlying FG, it’s likely that VNQ will wake up in party mode and begin trending higher again.
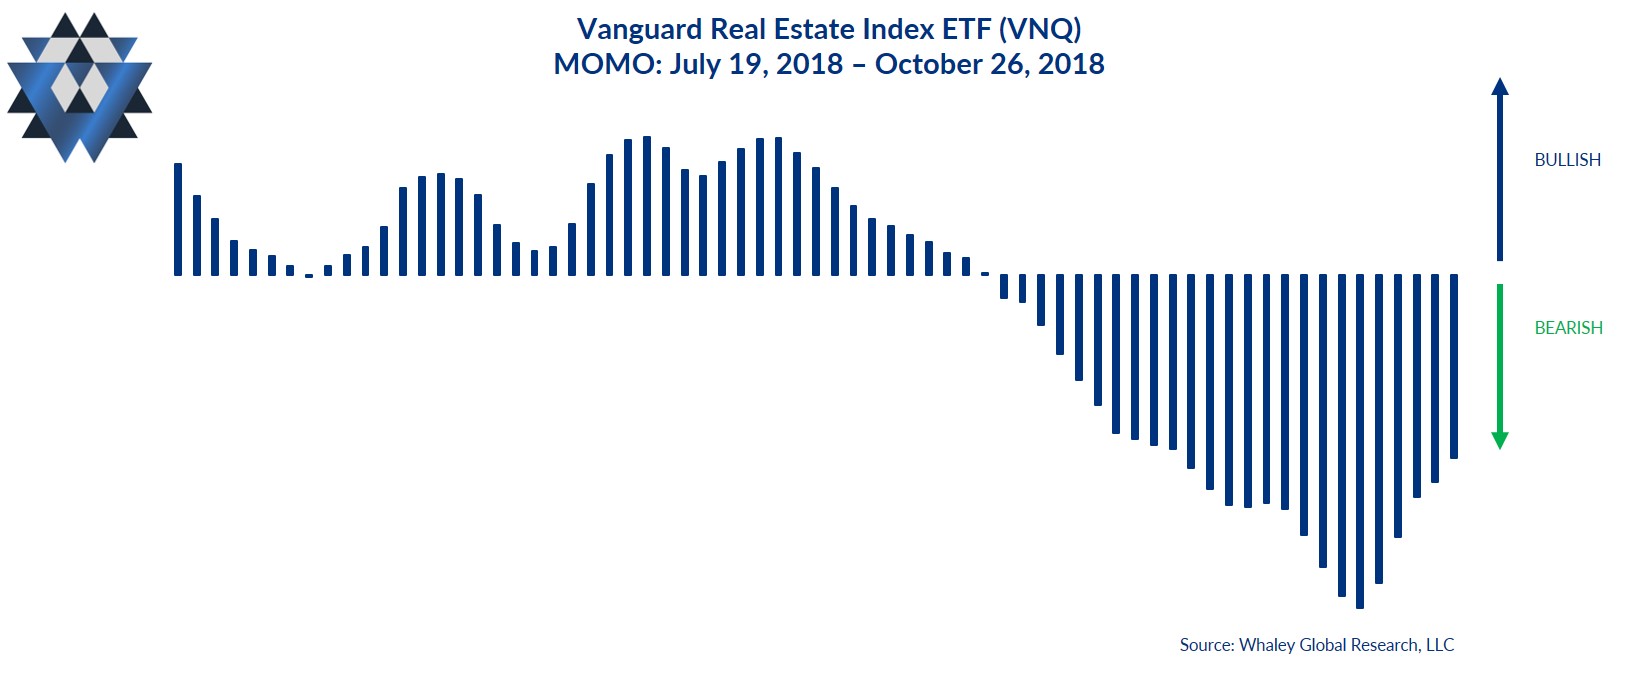
Momo is our measure of the amount of force behind the market’s current state. VNQ’s Momo has been on the bearish side of the ledger since September 20. Momo has been getting less bearish since October 17 and is now in neutral territory on its way to turning bullish.
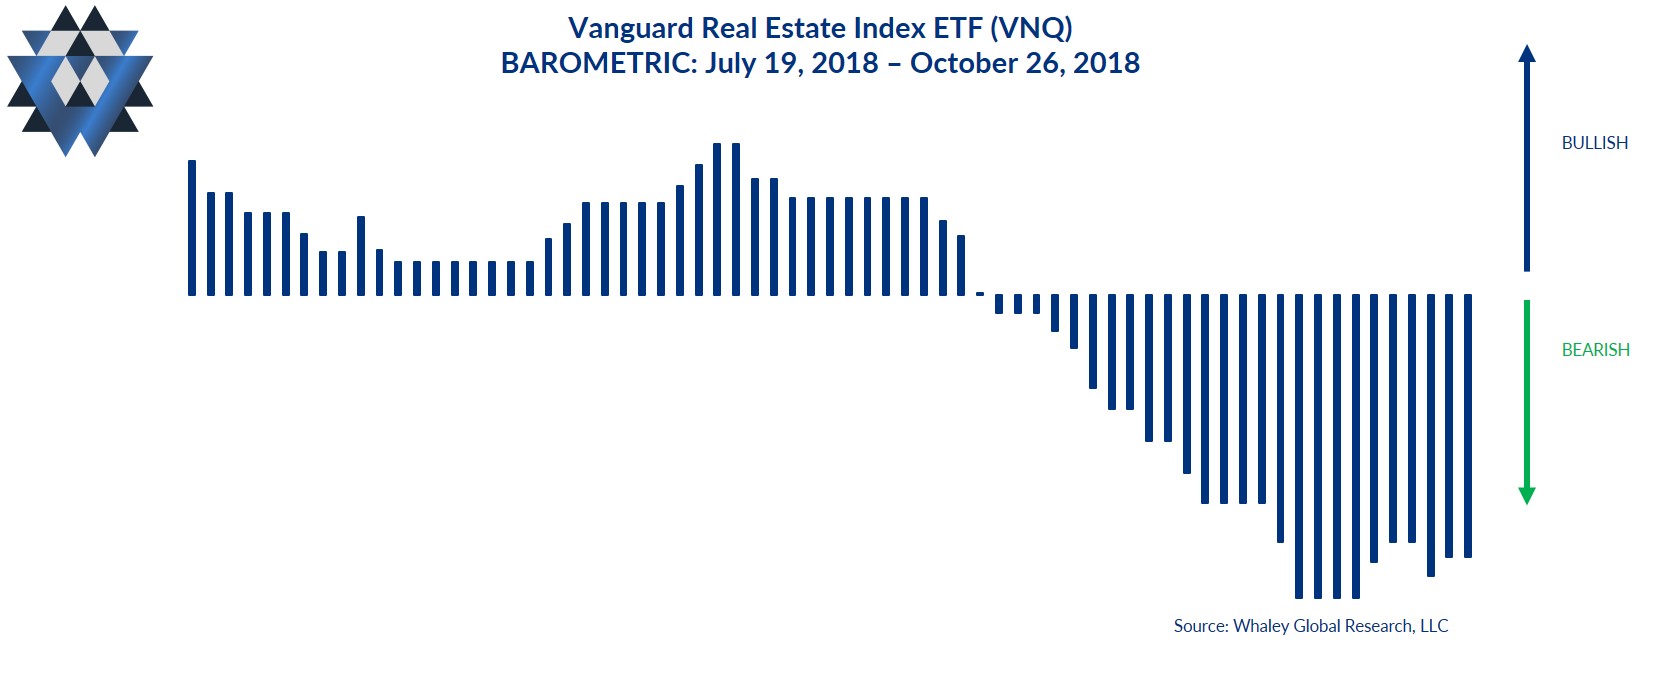
Barometric is our measure of buying and selling pressure or the rate of force behind the current Momo. VNQ’s Barometric indicates that sellers are in control of this market and have been so since September 27. Here again, the selling pressure has been lessening since October 11. This quantitative factor bears close monitoring because it’s the most bearish of all the QG components for VNQ.
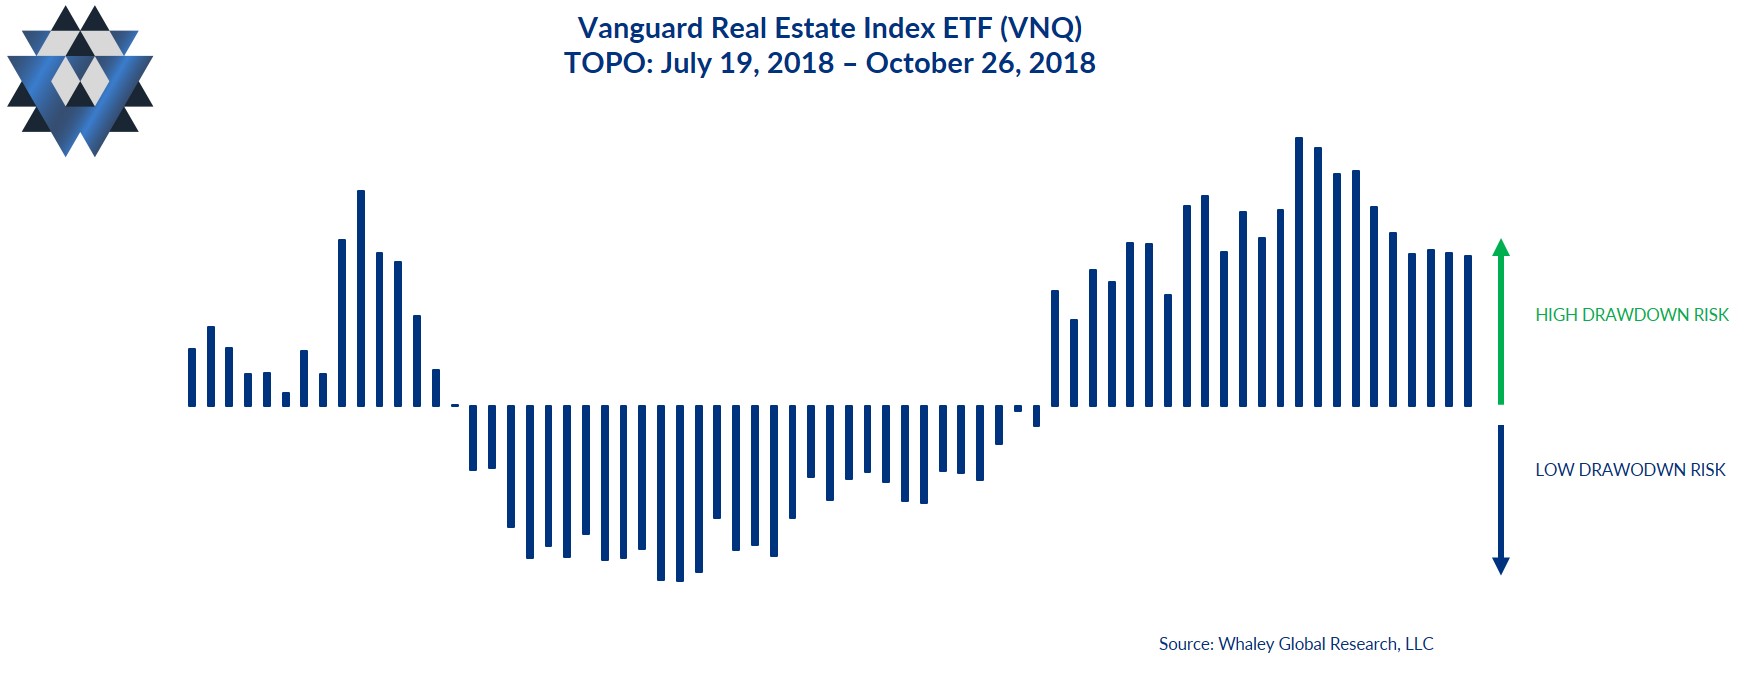
Topo, which measures the probability of a drawdown, is indicating a rising level of drawdown risk for VNQ over the next 10 trading days. VNQ’s Topo reading has been elevated since September 24 but the embedded level of drawdown risk in VNQ has been declining for over two weeks, since Topo peaked on October 11.
Alpine and Abyss Lines
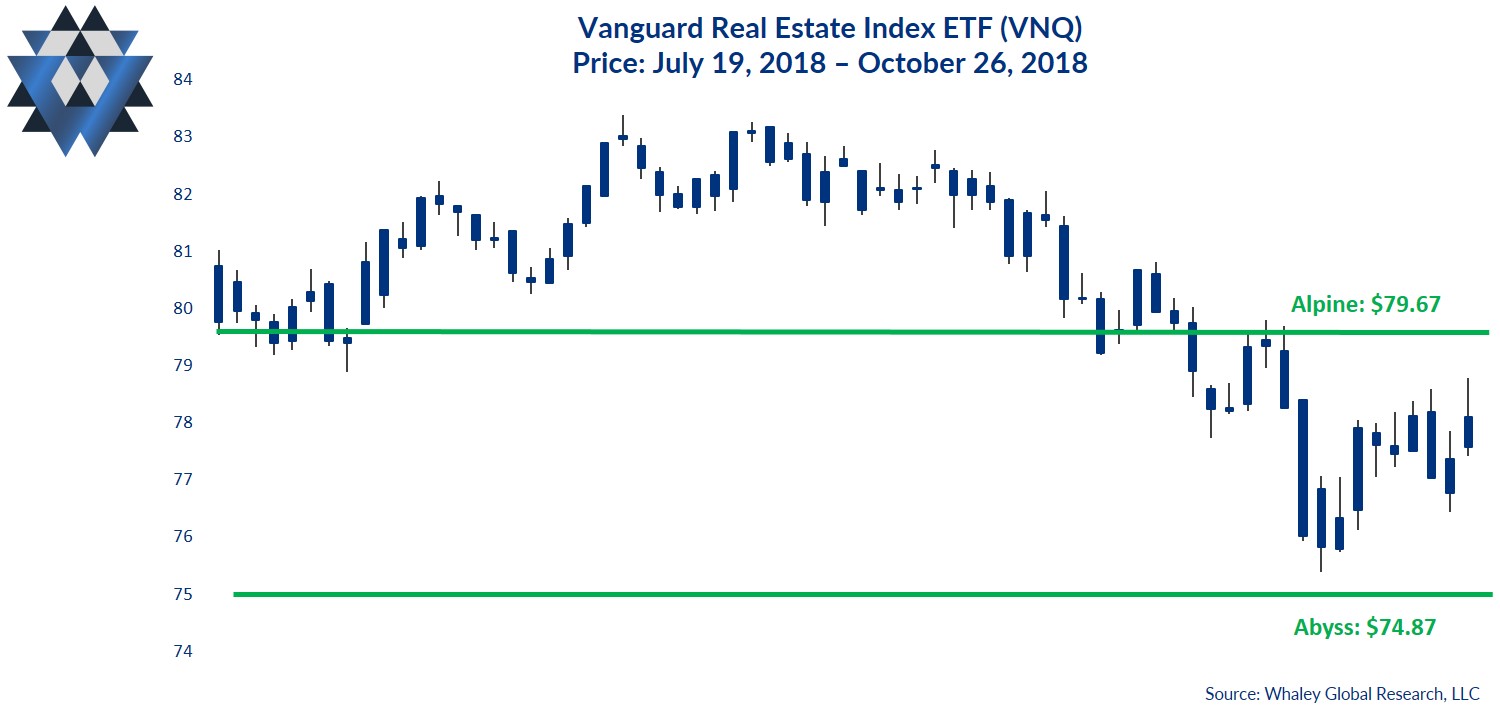
Our proprietary Alpine and Abyss lines are not “support” and “resistance.” Rather, they are the areas (calculated using fractal geometry and Chaos theory) above and below the most recent closing price where price is likely to experience an acceleration in its current trajectory, or a possible reversal of its current course. When a particular market’s price interacts with the Alpine or Abyss areas, regardless of whether the price is rejected by the Alpine or Abyss area or is able to breakout above (or breakdown below) it, the outcome gives you critical insight into the most likely direction of that market.
The most critical Alpine area for VNQ above Friday’s closing price is between $79.67 and $80.81. This means that it’s highly likely that any upside price momentum will stall at this area.
However, if VNQ closes decisively above that area, price is likely to accelerate higher from there.
The most critical Abyss area for VNQ below Friday’s closing price is between $75.38 and $74.87. This means that it’s highly likely that any downside price momentum will stall at this area. However, if VNQ closes decisively below that area, price is likely to accelerate lower from there.
The Quantitative Gravity bottom line is that VNQ has taken a bearish hit during October, like many other markets. However, a number of its quantitative factors have been turning less bearish over the last 10 trading days, and a few are outright bullish again.
Behavioral Gravity Says What?
Behavioral Gravity allows us to evaluate investors’ perception of this market and how that perception changes and shifts over time.
The Behavioral Gravity Index (BGI) for VNQ has been extremely bearish for several months now. The bearishness has been there all year as investors have yanked more than $2.3B from the ETF since January 1. It should be noted that over 25% of those outflows have occurred in just the last three weeks. Clearly investors don’t understand the implication of a Fundamental Gravity #4 environment and that REITs will likely be one of the best-performing U.S. equity sectors.
The Behavioral Gravity bottom line is that investors continue to pull money from VNQ in droves despite the current Fundamental Gravity and the fact that REITs are one of the best-performing sectors in this type of FG environment.
The Trade Idea
As long as VNQ trades above $74.87, new long trade ideas can be initiated opportunistically on pullbacks. Depending on your entry and how much room you want to give this trade idea to move, use a risk price between $76.44 and $74.87. That said, your risk price line in the sand is $74.87. If VNQ closes above that price, exit any open trades. If the trade moves in your favor and VNQ trades up to the area between $79.67 and $80.81, consider closing some, or all, of your position.
We are currently out of VNQ in our Asset Allocation Model and will send out an alert if we get the right entry price that skews the reward-to-risk characteristics of the long trade in our favor.
In addition to providing detailed analysis and trade ideas like this commentary on a weekly basis, we also provide real-time email alerts whenever we add, or close, a position in our Asset Allocation model inside our Gravitational Edge report.
Please click here and sign up if you’d like to receive an email alert when we initiate or close our position in this market and to participate in a four-week free trial of our research offering, which consists of three weekly reports: Gravitational Edge, The 358, and The Weekender.
Watch Landon Whaley’s 3 Ideas for Investing and the meaning of coddiwomple in a short video here.
Recorded: MoneyShow Dallas Oct. 5, 2018.
Duration: 6:42.
Watch Landon Whaley discuss When Markets Cycle in a short video here.
Landon Whaley: We have a generation of investors and asset managers who know only one market. The reality is markets and economies cycle and catch people off guard.
Recorded: MoneyShow Dallas Oct. 5, 2018.
Duration: 5:51.
Landon Whaley interviews Adrian Manz: How I approach stocks here.
Recorded: MoneyShow Dallas Oct. 5, 2018.
Duration: 7:48.
Landon Whaley interviews trader Jackie Ann Patterson: How I got started trading and how I approach it with my Truth about ETF Rotation here.
Recorded: MoneyShow Dallas Oct. 5, 2018.
Duration: 6:14.
Landon Whaley interviews John Carter: How I started trading here.
Recorded: MoneyShow Dallas Oct. 5, 2018.
Duration: 5:37.


