

Total vehicle sales in October were 17.5 million which beat estimates for 17 million and the high end of the expected range which was 17.2 million. It was also above last month’s report of 17.4 million, writes Don Kaufman Saturday.
This is exactly what I projected as Hurricane Michael boosted replacement sales. Vehicle sales have plateaued for the past 2.5 years which isn’t a bad thing. This is a case of a statistic reaching its limit, meaning rate of change data doesn’t forecast future results. Domestic vehicle sales were 13.6 million which was higher than September’s 13.3 million.
September factory orders were up 0.7% month over month which beat estimates for 0.4% growth. It beat the high end of the expected range which was 0.6%. This is great growth considering the fact that August growth was revised up from 2.3% to 2.6%. Durable goods orders were up 0.7% and non-durable goods orders were up 0.6%.
Core capital goods orders were down 0.1%. Unfilled orders were up 0.8% and 0.9% in the last two months.
Inventories were up 0.5%. This is all Q3 data, but it’s good to see some strength.
Trade deficit increases further
Q3 was hindered by weakness from exports. Even though President Trump’s goal with the tariffs is to lower the trade deficit, the deficit in September increased further. The deficit went from $53.3 billion to $54 billion. This was worse than the expectation for $53.5 billion.
Exports in September were strong as they increased 1.5% to $212.6 billion, but imports were also up 1.5% to $266.6 billion. Aircraft exports boosted capital goods exports by $1.1 billion to $47.5 billion. Industrial exports were up $2.8 billion to $46.9 billion.
As I described in the GDP report, exports were helped by soybean sales before the tariffs were implemented and hurt after they were implemented. This boosted agriculture exports in Q2 and hurt them in Q3. They fell $1 billion to $11 billion in September.
Consumer goods imports were up $2 billion to $55.4 billion. The tariffs will be affecting consumer goods in the next few months which could hurt import growth in this category.
It would be good for GDP for imports to fall, but it would be bad for the economy because the consumer would be hurt by the higher prices. Capital goods imports were up $2.4 billion to $60.1 billion. It’s good to see businesses investing to increase productivity.
As you can see from the chart below, the trade deficit with China increased to $40.2 billion from $38.6 billion. A record high trade deficit with China isn’t going to make Trump want to make a trade deal with China unless they make big changes. The trade deficit with Europe shrunk sharply from $15.7 billion to $10.6 billion.
Jobs report beats estimates & scares Wall Street
The October BLS jobs report was so great it even beat the ADP report’s number. There were 250,000 jobs created which beat estimates for 190,000 and the highest estimates for 231,000. Private job creation was 246,000 which was above estimates for 181,000 and the ADP report which showed 227,000 jobs created.
As you can see from the chart below, the 3-month moving average increased and the 12 month moving average fell. If job creation holds at an average of 213,000, this will be the third best year since 2000.
It doesn’t look like the business cycle is close to ending. Job growth in September was revised from 134,000 to 118,000. It was hurt by the hurricane. August job creation was revised up from 270,000 to 286,000, meaning 2 of the past 3 reports showed gangbuster job creation.
The unemployment rate was steady at 3.7%. The chart below breaks down the job creation by sector.
As you can see, manufacturing job growth was 32,000 which beat estimates for 13,000. The relatively strong ISM manufacturing PMI supports this job creation.
Education and health services led the pack with 44,000 jobs created and leisure and hospitality was second with 42,000 jobs created.
Stocks fall because of strong wage growth
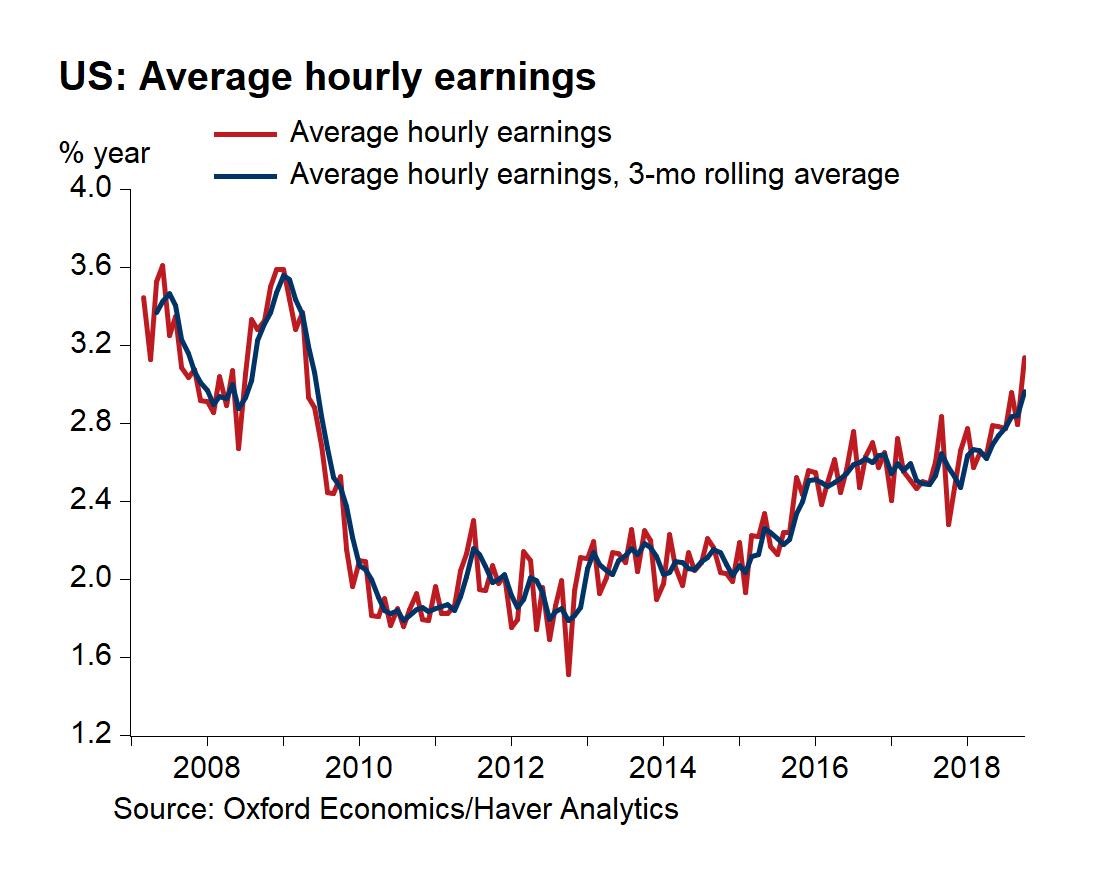
Average hourly earnings growth was 0.2% month over month which met estimates. As you can see from the chart below, year over year growth was 3.1% which beat estimates for 3%. This was much higher than the 2.8% growth in September.
This scared stock and bond investors because it means inflation and Fed rate hikes are coming. Average hours worked was steady at 34.5 hours which met estimates and was the same as last month. Average weekly wage growth was 3.44% which was much higher than the 3.09% growth in September. This was the highest weekly wage growth this cycle. It’s the fastest growth since August 2007.
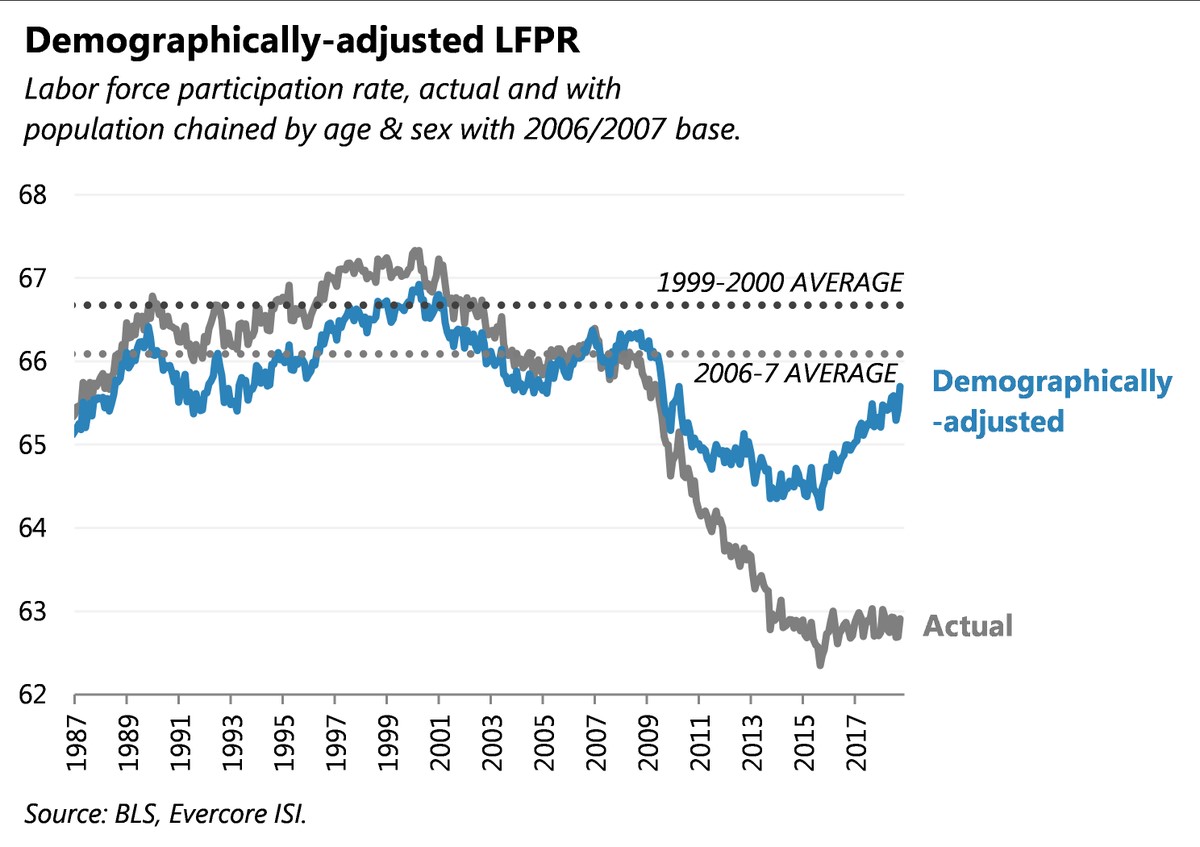
Strong labor participation rate
The labor participation rate increased from 62.7% to 62.9% which beat estimates for 62.8%. As you can see from the chart below, the demographically adjusted labor force participation rate is closing in on the 2006-2007 average, but it is still decently away from the 1999-2000 average.
The labor market is very close to full which means the cycle should end in the next 2-3 years. The prime age labor force participation rate increased sharply from 81.8% to 82.3%. That’s the highest since April 2010 when it was cratering. This report has had 2 steps forward and 1 step back, which means I expect it to fall in the next few months.
This means the labor market is closing in on full employment. It peaked at 83.4% last cycle. If it increases the same amount in the next two months, the labor market will be full. However, that’s highly unlikely to occur.
Conclusion
The labor market is probably 2-3 years away from reaching full employment, but the accelerated wage growth means the Fed will keep up with rate hikes in 2019.
At some point, the rate hikes will cause a recession. I think that will be in 2020. Since stocks fall six months before recessions, there might be a big decline in late 2019.
Subscribe to TheoTrade here...
View a brief video interview with Don Kaufman on volatility for traders and investors here
Recorded at TradersExpo New York Feb. 25, 2018
Duration: 2:34.


