

We have a lot to get into and we will start this note off with this week’s big news, which was delivered by Apple (AAPL), writes Nell Sloane in her wide-ranging Trading Notebook today.
Here are the numbers as reported:
- Q4 EPS: 2.91 billion, beating expected $2.78.
- Revenue: $62.9 billion, beating expected $61.44 billion.
- iPhone sales: 46.9 million, missing expected 48.4 million.
- iPad sales: 9.8 million, missing expected 10.5 million, and down from 10.3 million a year ago.
- Mac sales: 5.3 million, beating expected 4.9 million, and down from 5.4 million a year ago.
- iPhone ASP: $793, up from $618, smashing expected $729.
- Guidance for holiday quarter revenue: $89 billion-$93 billion, with the midline below Wall Street estimates of $92.74 billion (Zerohedge).
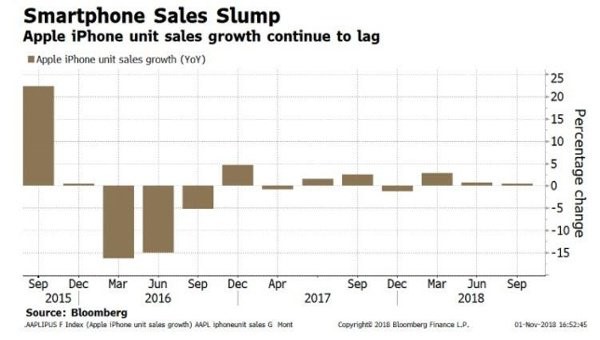
The following chart doesn’t look very optimistic to us. And it shouldn’t to you either:
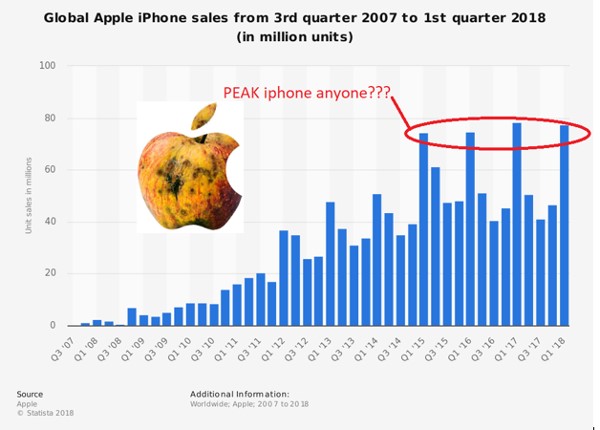
To add insult to injury Apple Inc. announced that it would stop providing unit sales numbers for iPhone, iPad and Mac.
It doesn’t take a genius to figure out why they are doing this, but we figure we bring this picture back out of the archives:
**
Apple has decided to try to raise prices in perpetuity in order to salvage margins, yet this late in the cycle, that strategy will be very difficult to complete. Just to be fair let’s point out some good things.
Apple used cash on hand to buyback stocks and fund dividends, instead of issuing more debt, which as we know returns more of the value of the company back to the shareholders. However, in doing such and considering the softer outlook, we don’t think Apple can continue this given the constant decrease in their net cash stockpile which hit 2014 levels of $123 billion down some $40 billion from their peak.
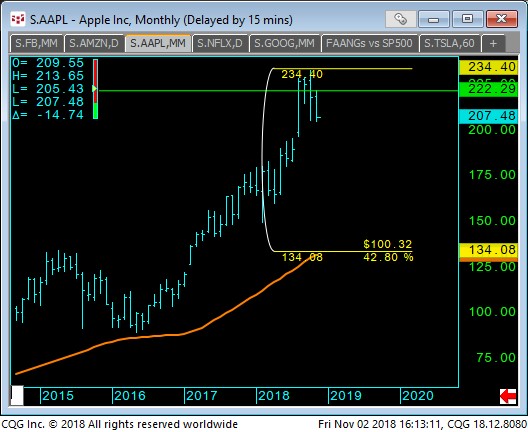
As for the overall equity chart of Apple Inc. we feel that logical support is well below down at the Vwap, some 42% off the high:
**
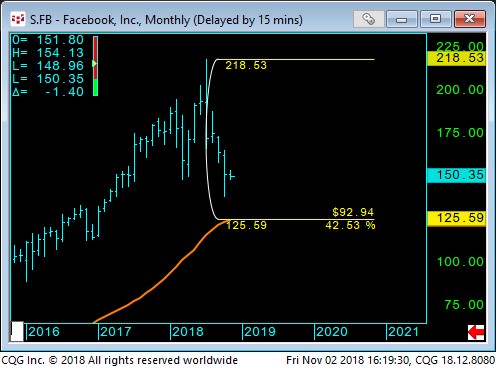
We know perma-bulls may not believe it can fall that far, but we point out this next chart, none other than Facebook (FB) which has given up similar ground:
**
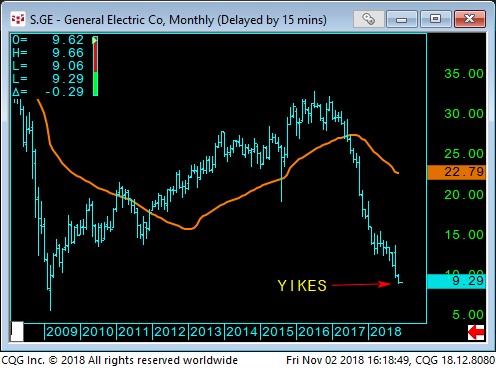
We also saw this chart this week and the WSJ put GE (GE) on its cover Wednesday as the company revealed that the feds have opened up a criminal accounting investigation and to add insult, GE cut its dividend.
Well, if this chart doesn’t scream breakup value, not sure what will.
By the way who says you can’t go back in time, does it seem like 2009?
But, this time around there isn’t TARP and QE for GE to fall back on:
**
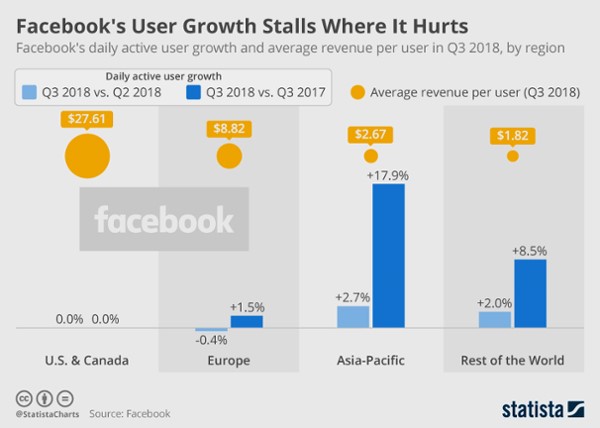
Speaking of Facebook (FB), Statista had this as one of their charts of the week, which points out the obvious.
The bang per buck per user is dismal outside of the U.S.:
**
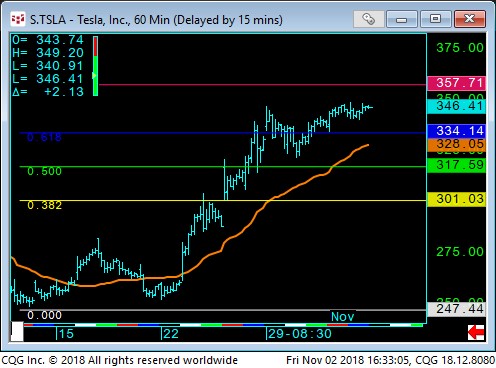
Hey what about our favorite Unicorn and its fearless leader, Tesla (TSLA) and Elon Musk posted great earnings a week ago.
The big news was the 83,000 in total deliveries compared to 26,000 a year earlier. (WSJ)
Investors love this stock and it seems $250 is the buy zone, anyway, we suspect $357 offers resistance.
And as usual we fail to see the upside here, especially given the fact that Porsche is well entrenched in electric technology and obviously better equipped to handle future growth, but that’s just us. Anyway, here is the Tesla chart:
**
We all know that Amazon (AMZN) and Alphabet (GOOG) have been raining on the FAANG parade lately as they both reported underwhelming sales growth a week ago. (WSJ)
It’s hard not to follow their lead lower for the rest of the market, as they have been the standouts and we feel people should be aware of these signs in the markets.
We have told readers for quite some time that smart money, large institutional types have been exiting for quite a while and it’s always retail that is late to the ball game.
We hope you see this writing on the wall and continue to monitor your own risk/reward profiles as times, they are a changing!
**
What’s changed exactly? We have spoken at length that the bond markets have signaled higher rates to come and that despite POTUS and his harsh rhetoric toward the Fed, they will indeed continue their rate hike campaign.
We spoke with one of our friends who works for one of the big guys and their call stands at five more rate hikes. We tend to agree.
The goal is to get Fed Funds above U.S. 10-year and there is no doubt in my mind they will do it.
You see as rates rise, so too does the discount by which you value future cash flows and thus if your money is discounted by a higher rate, your values have to move lower across your time spectrum.
This adjustment, which we believe many if not the majority don’t even understand that catches people off guard. And it’s why we watch the bond market signals, more so than the equity markets’ euphoric nature.
**
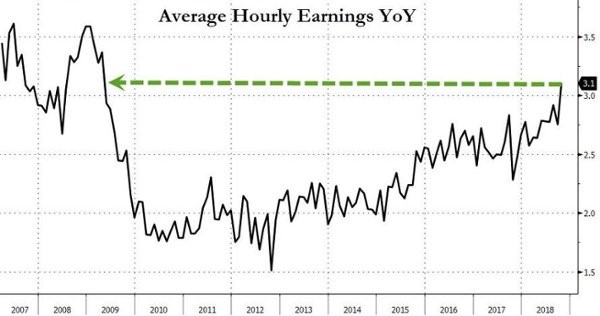
What else happened? Friday gave us the nonfarm print which was decent, but more troubling for the Fed was the average hourly earnings which hit 3.1%.
**
This is already on top of the heavy price increases that the conglomerates have been trying to pass through to the consumer pipelines. We have always said, if you raise rates, you raise inflation and voila, look at what’s happening…
This is also why we feel the Fed will continue to raise as they will do so in order to bring down asset prices to more manageable price levels, from their linear euphoric rise.
**
We also read this week from Grants that, “Investors don’t necessarily seem to be buying into a rosy economic outlook.”
According to the BAML October Fund Manager Survey, “a record 85% of respondents think the global economy is in the late cycle, 11% above the prior highs of December 2007,” while a “net 38% of respondents expect [economic] deceleration, the worst outlook on global growth since November 2008.”
How is it that the majority see the coming slowdown, yet equity market participants still expect constant earnings multiple expansion?
Something’s off, you can’t have your cake and eat it too, sorry, you can’t expect a slowdown and continued expansion. Economics doesn’t work that way. So, we will just have to say that the majority are saying and doing things that simply don’t make sense.
Maybe the world is off its rocker, maybe this duality of slow growth and continued growth is possible and this time is different.
No, perhaps reality hasn’t caught up to the markets just yet, but we know the powder keg is still intact and the match is ready to be lit. The writing’s on the wall and as we stated before, it’s the bond markets that forecast things the best.
**
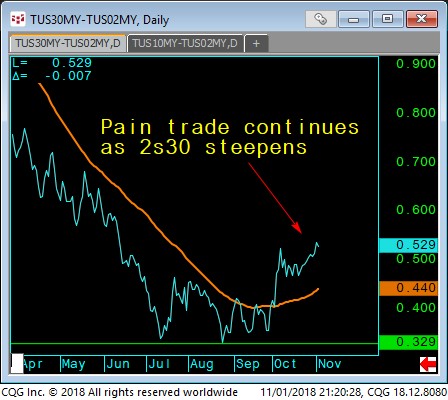
When we look at the U.S. government 2s/30 spread we can see that someone thinks the Fed has gone a bit too far and the curve was too flat.
We aren’t sure if this is a short-term stronger dollar plus a little risk premium reduction out of equities into short term notes, but one thing is certain, the flattening is not over, just postponed:
The long end of the U.S. 10-year sector has seen a reversal from the 3.07% level as predicted and is now in supply swallowing mode as the U.S. is going to issue a massive amount of debt.
The preliminary outlook a few months ago was for an issuance of $78 billion. However that was well underestimated as the Treasury is now on tap to issue some $83 billion, which puts the U.S. deficit at the $780 billion mark and counting.
Anyway, yields have popped and rightfully so, as equities have bounced.
**
Finally let’s look at the euro (EUR) currency which seems to have reached another test of its lower bound below the 114 area.
The stronger dollar has weighed in here and we think it may continue just a bit, seems like bounces will be sold into.
**
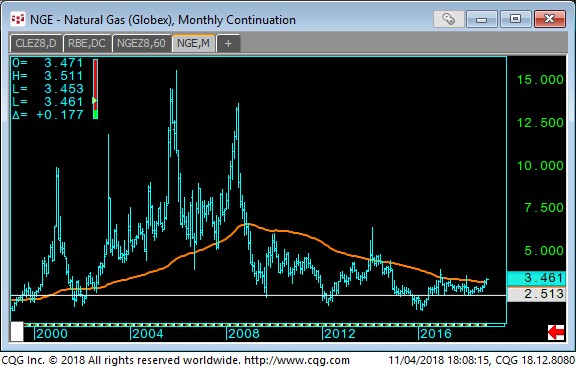
This just in, before sending out we noticed this large jump in Nat Gas on the Sunday night open, up a large gaping 21.2 to 3.496:
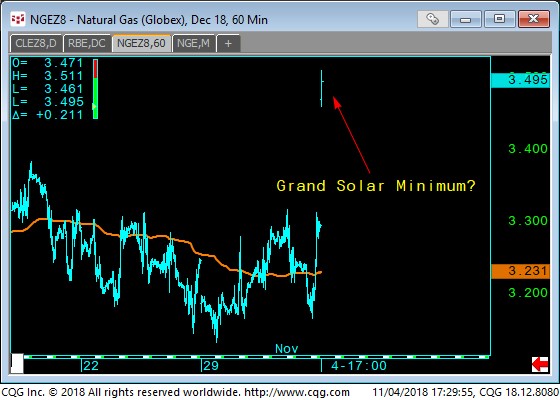
We have spoken bullishly of Nat Gas for the last few weeks and in consideration of both the fundamental lack of available supply, but even more so on the heels of Solar Cycle 24 or Grand Solar Minimum. Anyway, for those that don’t watch or monitor Nat Gas, it has exhibited in the past some very large unforgiving moves and we present this chart as evidence:
Ok, that’s it, folks, we hope you enjoyed this week’s note.
We continue to monitor gold as it seems like some buyers keep stepping in on every retreat. We also like to watch the Natural Gas market as colder weather is upon us earlier than usual and it may be around for a lot longer than most think.
Crude continues to suffer as it broke $67 and now trades near important support at $63. Anyway, check your risk tolerances, prepare for wide ranges and always, be on the lookout for the next winning trade!
Cheers,
Nell
Subscribe to Nell Sloane's free Unique Insights and CryptoCorner newsletters here


