

The Emini monthly chart is in a bull trend, but the February and October selloffs were unusually strong. Furthermore, they followed the most extreme buy climax in the 100 year history of the stock market, writes Dr. Al Brooks Saturday.
Therefore, the bulls might not yet have recovered from their exhaustion. Consequently, while the odds favor a new high before there is a bear trend, the monthly chart could continue sideways for several more months first. In addition, there is a 40% chance of at least a small 2nd leg sideways to down to below the October low over the next few months before there is a new high.
The Emini weekly chart has been in a trading range for a year. While it reversed up sharply over the past 2 weeks, the tails on the tops of the 2 most recent bars make more sideways trading likely for the next several weeks.
Finally, the Emini daily chart reverse up sharply after a parabolic wedge sell climax in October. The current rally is stalling at the October 17 major lower high. While the bears want a double top bear flag, it is more likely that the bulls will buy the first 1 – 2 week selloff. The downside risk over the next month is small. But, the reversal up after a sell climax created a Big Down, Big Up pattern. That results in Big Confusion, which typically leads to a trading range for 10 – 20 bars (2 – 4 weeks on the daily chart).
Euro/U.S. dollar (EUR/USD) weekly forex chart: Likely brief bear breakout
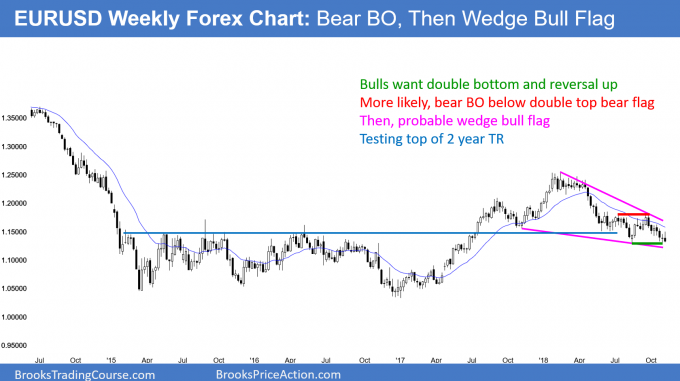
The candlestick pattern on the EUR/USD weekly Forex chart is a reversal down from a double top bear flag. The momentum is strong enough so that the selloff should fall below the October low.
I wrote last week that the buy signal bar from two weeks ago was only a doji bar. I further said that it was the 6th bar in a bear channel without any pullbacks. Therefore, it was a weak buy setup. As expected, there were more sellers than buyers above its high.
The bulls want the August/October double bottom to lead to a rally. But, the momentum down from the July/September double top bear flag has been strong. Therefore, the selloff will probably break below the double double within the next week or two.
However, trading ranges resist successful breakouts. In addition, if there is a 100 pip breakout down to 1.12 and then a reversal, that would be a buy signal. The bulls would have a wedge bull flag based on the November/August lows. In addition, it would be a test of the top of the 2015 – 2016 trading range.
Traders will watch for a reversal up from there. If there is no credible bottom, then traders will expect the bear trend to fall for a 500 pip measured move based on the July/September double top bear flag.
Currently, the most likely outcome is a failed breakout below the double bottom and a reversal up from around 1.12 based on the yearlong wedge bull flag.
Crude oil futures: Parabolic wedge sell climax at support
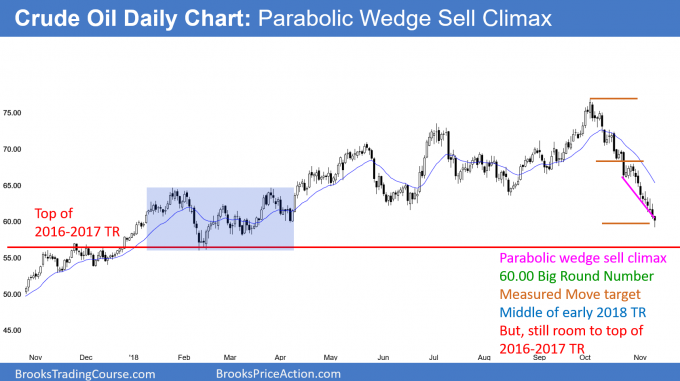
The candlestick pattern on the daily crude oil futures chart is a parabolic wedge sell climax in an area of support.
The crude oil daily futures chart has been in a strong bear breakout for six weeks. Although there is room to the top of the 2016 – 2017 trading range, the current selloff has had 3 legs down in a tight bear channel. This is a parabolic wedge sell climax. Typically, the selling will stop here or soon. This is especially true because crude oil tends to respect Big Round Numbers. and the selloff tested 60.00 on Friday.
Since the wedge bear channel is tight, the 1st reversal up will be minor. That means it will test prior minor lower highs and possibly the 20 day EMA. The most recent minor lower high is the top of the five-day bear channel on the 240 minute chart, which is around 64.00. A rally there will also be around the 20 day EMA.
What about a continued selloff?
Can crude oil continue down to around 57 at the top of the 2016 – 2017 trading range before bouncing? Yes, but the current selloff is extreme. A parabolic wedge is a sell climax. The bears know there is a risk of a sharp reversal up. They don’t want to watch their profits evaporate. Consequently, they will be quick to take profits if the selloff stalls.
Since the bulls know this, they will begin to buy new lows, expecting small rallies to above prior lows. As those rallies get bigger, the bulls will hold for bigger profits. In addition, the bears will begin to take profits on their shorts.
The result is a rally to resistance, where the bulls will take profits and the bears will sell again. As a minimum goal, traders look for at least a couple legs up to resistance, like a minor lower high or the EMA.
There is no bottom yet, but traders will look to buy once there is a bull bar closing near its high. They will be more aggressive if there is a micro double bottom.
Gold futures: Low 2 bear flag at 20 week EMA after parabolic wedge sell climax
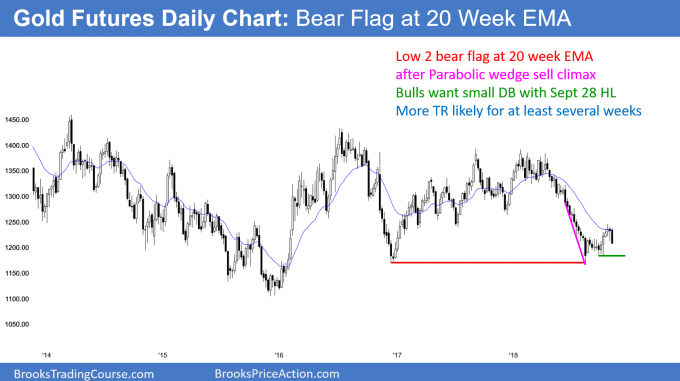
The candlestick pattern on the daily gold futures chart is a low 2 bear flag at the 20 week EMA. This followed a parabolic wedge sell climax.
The Gold futures weekly chart had a parabolic wedge sell climax and then a 2-legged rally to the 20 day EMA. This is what is likely on the daily crude oil chart. As is typical, the bears sold the Low 2 bear flag at the EMA. Since the reversal up was relatively strong, the selloff will probably stall in the August/September trading range. As a result, traders will be looking for quick profits over the next month, expecting reversals up and down every few days.
Monthly S&P500 Emini futures candlestick chart:
Strong bounce off the EMA after big down month in October
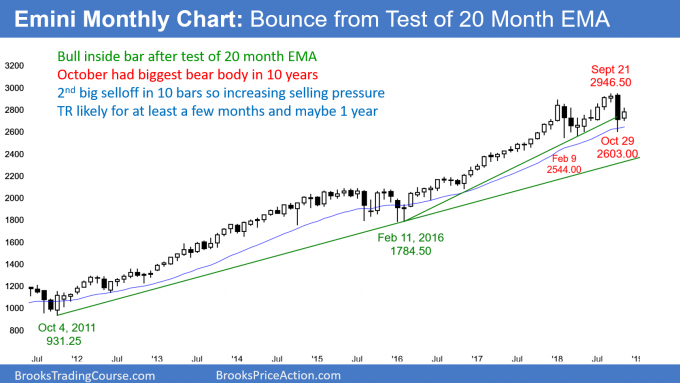
The candlestick pattern on the monthly S&P500 Emini futures candlestick chart is a bull inside bar so far in November. This follows the big bear bar in October. The monthly chart has been in a trading range for 10 months.
The monthly S&P 500 Emini futures candlestick chart is rallying from the first pullback to its 20 month EMA in over 20 months. This is a 20 Gap Bar buy signal. There has been a gap between the low of every bar and the EMA for a long time. This is a result of eager bulls who were happy to pay an above average price. At the end of October, they finally got a discount down to the average price, and they bought aggressively.
But, the October candlestick had the biggest bear body of any bar in 10 years. Furthermore, February was also a big bear bar. With two big bear bars, the odds are against a strong resumption of the 10 year bull trend without the bulls creating some bull bars.
While the late November rally might quickly lead to a new all-time high, that high will probably not last more than a few months. This is because the strong selling pressure in February and October is telling us that the bears are willing to sell. Consequently, they will sell above the yearlong trading range if they get the opportunity.
Big Down, Big Up creates big confusion and a trading range
More likely, instead of racing up to a new high, the Emini will likely have to go sideways for several months. The bulls will probably need a foundation of a few bull bars before traders will trust their ability to hold the market up. As a result, the bulls will probably buy pullbacks, but they will also likely take profits around the trading range high.
In addition, the bears see how dramatically the bulls gave up around 3,000 twice this year. This will give them confidence to sell aggressively again around that number.
The bears also saw how strongly the bulls bought between 2,600 and 2,700 twice this year. They will therefore take profits on their shorts near the bottom of the range.
With bulls and bears both buying low, selling high, and taking quick profits, the yearlong trading range will probably continue for at least a few more months. This is true even if there is a brief new high within a few months.
Weekly S&P500 Emini futures candlestick chart:
Triggered a buy signal by going above last week’s high
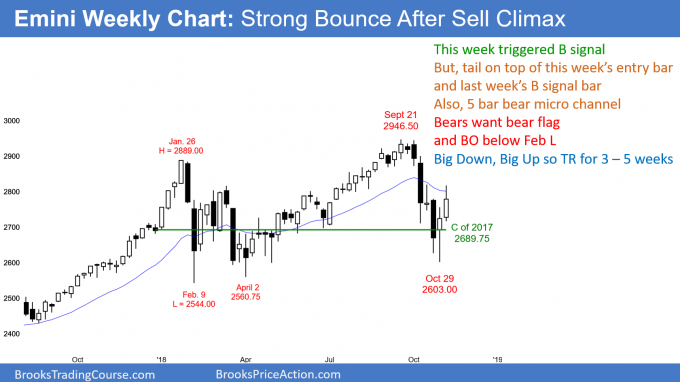
The weekly S&P 500 Emini futures candlestick chart continued last week’s strong reversal up. The rally retraced about half of October’s selloff.
The weekly S&P 500 Emini futures candlestick chart formed a big bull trend bar this week after last week’s bull trend reversal. Last week was a buy signal bar. However, the tail on top was a sign that the bulls were not buying into the end of the week. This makes the buy signal not as convincing.
In addition, every high for the past five weeks was below the high of the prior week. This is a 5 bar bear micro channel, and it is a sign of strong bears. Typically, the 1st reversal up from a bear micro channel stalls within a week or two.
This makes the coming week important. If it is a bear bar or a small bull bar, it would represent a lack of follow-through buying. That would increase the chance of a pullback within a few weeks and a continuation of the yearlong trading range.
However, if this week (Nov. 12) is a big bull bar closing on its high, that would erase the problems of the bear micro channel and the tail atop last week’s candlestick. The rally would then probably reach the measured move targets around 3,100 and 3,200 within the next few months.
Daily S&P 500 Emini futures candlestick chart:
Emini strong late October reversal after parabolic wedge sell climax
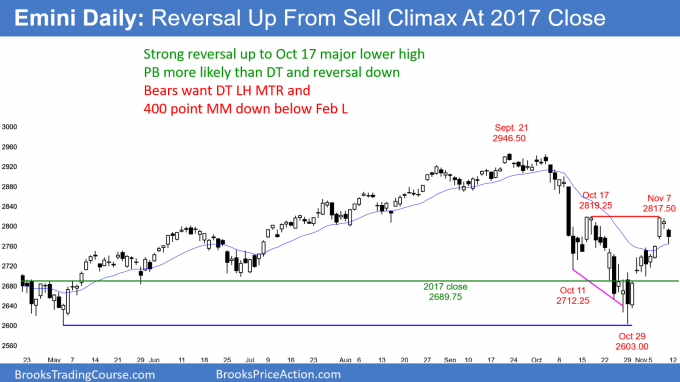
The daily S&P500 Emini futures candlestick chart has rallied strongly for two weeks. It is now testing the October 17 major lower high.
The daily S&P 500 Emini futures candlestick chart raced up to the October 17 major lower high over the past 2 weeks. I wrote on October 26 that the parabolic wedge selloff to the bottom of the year-long trading range would lead to a strong reversal up to the October lower high just above 2,800.
While the rally has been very strong, it is unsustainable and therefore climactic. The bulls probably will get a brief 10 – 30 point break above the high. Then, they will likely take profits. This will result in a 1 – 2 week selloff. The bulls will buy it, betting on a 2nd leg up.
A reversal up from around 2700 would create a higher low major trend reversal and a head and shoulders bottom. This would increase the chance of a new all-time high within the next few months.
Can the bears get a double top with the October 17 major lower high?
When there is a strong sell-off like in October, traders have to be thinking that it could be the start of a bear trend.
A trend will often have a strong reversal up that tests a prior major lower high, like the October 17 high. Then, the rally stalls and there is a pullback. But, instead of the pullback quickly having a bull breakout and leading to a resumption of the bull trend, it keeps growing.
This type of endless pullback typically has a 40% chance of breaking below the neck line of the October double top and selling off for a measured move down. That neckline is the October low.
This rally is different. It is unusually strong. Consequently, there is only a 30% chance of a strong break below the October low at this point. More likely, bulls will buy the 1st 1 – 2 week selloff to around a 50% retracement and 2700, and form the higher low major trend reversal that I mentioned above.
Trading Room
Traders can see the end of the day bar-by-bar price action report by signing up for free at BrooksPriceAction.com. I talk about the detailed Emini price action real-time throughout the day in the BrooksPriceAction.com trading room. We offer a 2 day free trial.


