

The PPI report is always important because it’s the first of the 3 major government produced inflation reports and because inflation in the supply chain gives us an early look at how much inflation on consumer goods is coming, writes Don Kaufman Sunday.
Oil drove headline inflation higher, but core inflation decelerated. Month over month inflation was 0.6% which beat the consensus and the prior growth of 0.2%. It beat the high end of the consensus range which was 0.4%. On a year over year basis, it was up 2.9% which accelerated from 2.6% growth in September.
This isn’t a big deal because oil’s sharp decline in the past 10 days assures us headline inflation will fall in November.
Without food and energy, inflation was 0.5% month over month which beat estimates and the consensus of 0.2%. It also beat the high end of the estimate range which was 0.3%. Year over year it was 2.6% which was up from 2.5%.
Finally, PPI excluding food, energy, and trade services was 0.2% month over month which met estimates and was below September’s growth of 0.4%. Year over year growth fell from 2.9% to 2.8%.
The headline increase in PPI was the highest in six years and PPI excluding food and energy was the highest in almost 7 years. The inflation acceleration mostly came from trade services. This category tracks the costs of wholesalers and retailers. It was up 1.6% month over month. Food prices were up 1% month over month and down 0.7% year over year. Energy prices were up 2.7% month over month and 12.5% year over year. Since oil prices rose last November and are falling this November, year over year growth will fall sharply. Interestingly, even though trade services were up huge month over month, they were only up 1.5% year over year.
Construction costs were up 1.9% month over month and 4.7% year over year. This makes sense because the construction sector is facing extreme labor shortages and is dealing with the tariffs increasing prices for primary metals.
Finished goods prices were up 0.7% month over month and 3.4% year over year. Consumer goods were up 1% month over month and 3.9% year over year. This report will push up estimates for CPI which will take a bite out of real wage growth. The October CPI report will come out next Wednesday on November 14th. Finally, finished services inflation was 0.6% month over month and 2.5% year over year.
S&P 500 valuations
Many of the valuation metrics calculated by investment banks are from October 31st which is when stocks were extremely oversold as they bottomed two days earlier. Therefore, valuations are a little bit pricier than what’s listed below. As you can see in the Merrill Lynch table below, 15 out of 20 metrics show stocks are expensive. The good news is with the previous earnings growth and weakness in stocks, the trailing GAAP PE is only 15% higher than average and the forward consensus PE is only 1% more expensive than average.
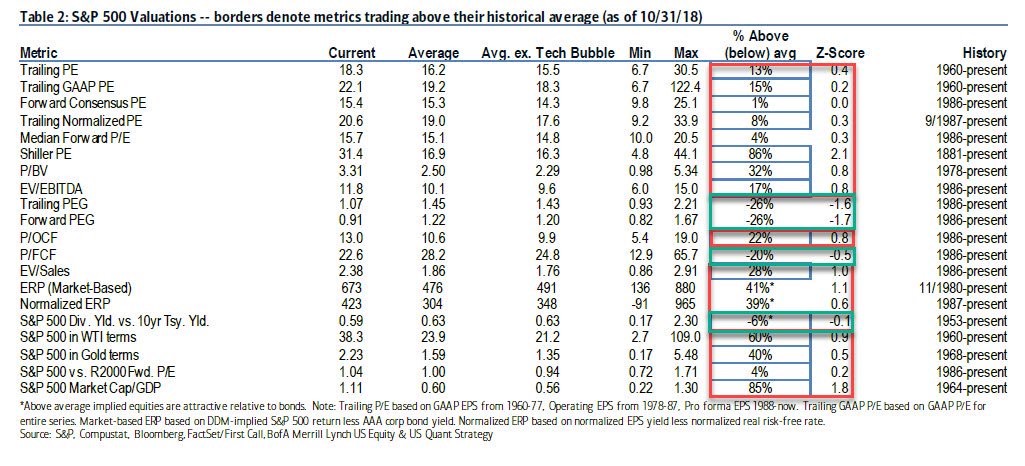
The bad news is the trailing GAAP PE is 3.8 points above the average after excluding the tech bubble and the forward PE is 1.1 points higher excluding the tech bubble.
The trailing PEG shows stocks are 26% too cheap because earnings growth has been amazing. However, the 2018 earnings growth rate isn’t sustainable especially since earnings estimate revisions have been falling. The forward PEG of 0.91 is also 26% below the long-term average. However, if earnings estimates continue to fall, that will quickly change.
I don’t care about the S&P 500 (SPX) in WTI and gold terms, so those metrics should be ignored. Gold prices are irrelevant and oil prices vacillate based on supply and demand which means increased supply and efficiency gains should allow this metric to increase over time.
Global Recession Coming In 2019?
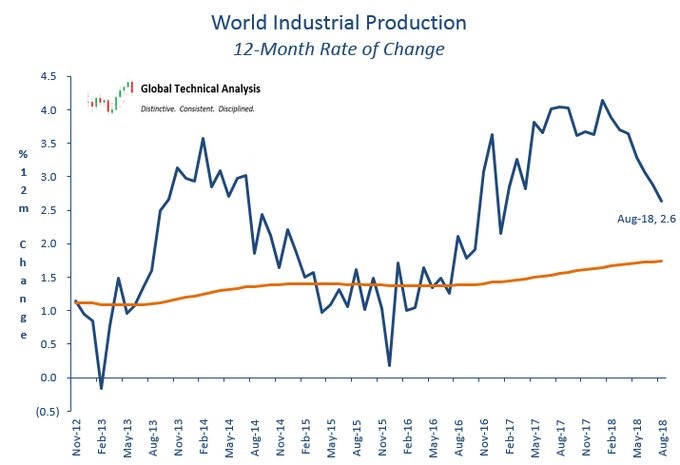
Just because growth in the American economy is slowing doesn’t mean you can take your eyes off the global growth weakness which has been going on for much longer. The American growth slowdown pushes the odds of a global recession up. As you can see from the chart below, growth in the world industrial production index has fallen from above 4% to just 2.6% in August. It will probably fall further in the next few months.
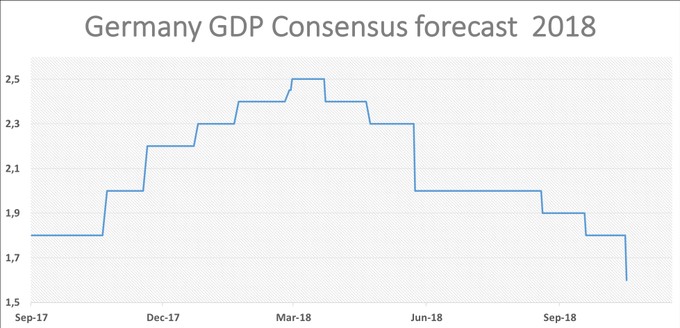
German exports to China are slowing so its 2018 GDP estimates are also falling. The German Council on Economics cut its estimate for 2018 GDP growth from 2.3% to 1.6% and its estimate for 2019 GDP growth from 1.8% to 1.5% which is close to its potential growth rate. As you can see from the chart below, the 2018 GDP growth consensus has fallen from 2.5% to 1.6%. Chinese demand is slowing.
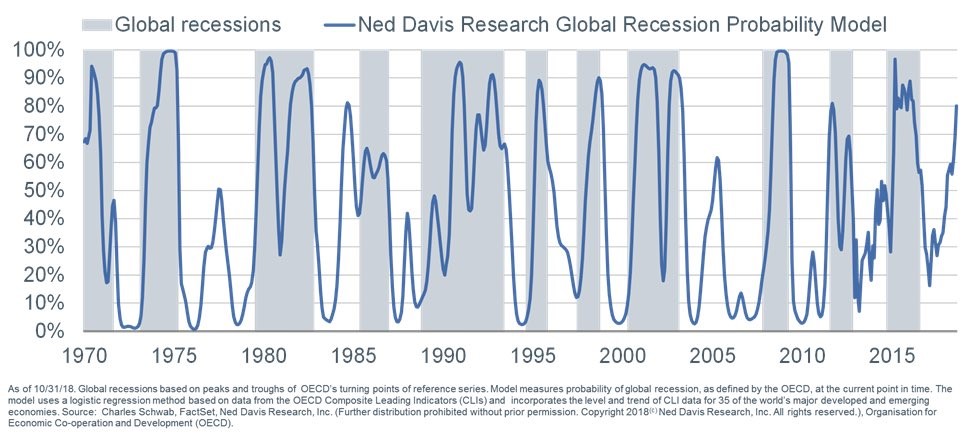
The Ned Davis Research recession model based on the Treasury yield curve shows there is only about a 15% chance of a recession in the next 12 months. Keep in mind, this is the highest it has been in this cycle and that it only peaked at about 40% prior to the previous recession. I don’t think there will be a recession in 12 months, but I do think there will be one in 24 months.
The Ned Davis prognostication for a global recession is much more dire as you can see in the chart below. There is about an 80% chance there will be a global recession in the next year. During the global recession in 2012, the rate peaked at about where it is now. There seems to be nothing that will catalyze growth to improve in the next six months.
Conclusion
The PPI report shouldn’t affect Fed policy. Since oil has been declining, headline inflation will follow it lower in November.
Real wage growth will be strong in November.
I think the Fed is closing in on being too hawkish. Commodity prices haven’t done much this year and wage growth hasn’t pushed up inflation. If the Fed raises rates 3 times next year after raising them 4 times in 2018, it all but assures there will be a recession in 2020.


