

The lack of consensus over what the market wants to do has resulted in a trading range for the past 2 months. Traders are taking quick profits and are unwilling to bet on a breakout, writes Dr. Al Brooks Saturday.
While the Emini might dip below the February low within a week, it will probably end the year in the trading range. Consequently, it will probably close above the February low and below last year’s close. Since the Emini is near the bottom of the range, it will probably reverse up to the middle or top of the range before then end of the year.
Monthly S&P 500 Emini futures candlestick chart:
2nd leg down is testing bottom of trading range
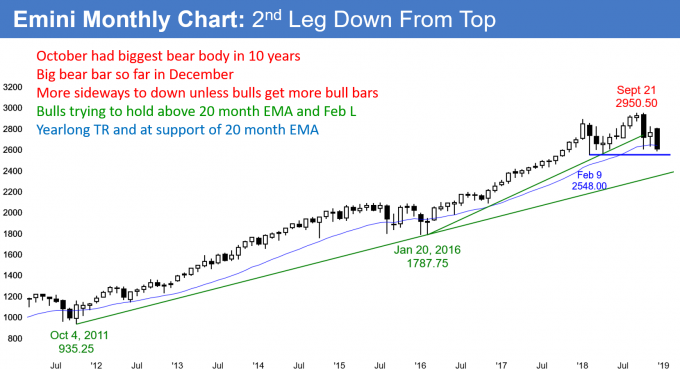
The monthly S&P 500 Emini futures candlestick chart has a big bear bar so far in December. The bears want a breakout below the February low. However, trading ranges resist breaking out and therefore a bounce is more likely. If they get a breakout, the next support is the bull trend line below 2400.
The monthly S&P 500 Emini futures candlestick chart turned down from a double top in October. October had the biggest bear body of any bar in over 100 bars. It therefore has an increased potential to lead to several more months of sideways to down trading.
After staying above the 20-month EMA for more than 20 months, the Emini dipped slightly below it in October. November and December also tested below. However, the bears do not have a close below it yet. If they get 2 closes at least a little below the EMA or a huge bear bar closing far below, the Emini will probably fall to the bull trend line below 2400.
Without that, the Emini will probably stay in its yearlong trading range for at least a few more months. If it can’t go down, it will probably test up. But, that huge bear body in October will make it difficult for the bulls to get a quick rally to a new all-time high.
Strong selling like that typically does not reverse up sharply. There is usually at least 3 – 5 sideways bars when the market transitions from the bears being in control to a small trading range. Once the bulls are confident that the bears have lost control, they will be willing to buy again. At that point, they could create a rally to test the old high.+
Weekly S&P500 Emini futures candlestick chart:
Follow-through selling after outside down week, testing February low
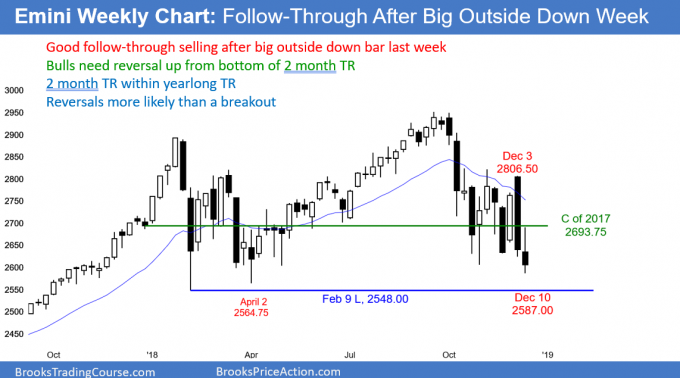
The weekly S&P 500 Emini futures candlestick chart had a huge outside down bar last week. This week triggered a sell signal by trading below last week’s low. However, the week had a big tail below. It was therefore making it a weaker entry bar for the bears. This reduces the chance of a successful break below the February low before the end of the year.
The weekly S&P 500 Emini futures candlestick chart triggered a sell signal this week by trading below last week’s low. Last week was a big outside down bar and it closed below the low of the prior week. That is good for the bears.
But, the bar is in a tight trading range, which is a Limit Order Market. This means there are usually more buyers below bars and sellers above. This is true even when there are strong trend bars. Last week was a huge bear trend bar, but there was not strong selling below its low this week.
Look back over the past 2 months. Traders sold above big bull bars and bought below big bear bars. They are buying low, selling high, and taking quick profits. This created the trading range of the past 8 weeks.
The bears need consecutive closes below the October low. In addition, if those 2 bars are big bear bars closing near their lows, their breakout below the 2 month range will probably lead to a 200 point measured move down. That is near the bull trend line on the monthly chart. The selloff would probably get drawn down to that magnet before the bulls would look for a reversal up.
Daily S&P500 Emini futures candlestick chart:
Emini in trading range between 2017 close and February low
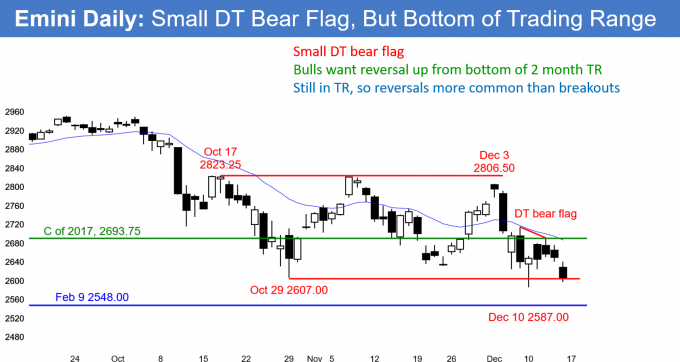
The daily S&P 500 Emini futures candlestick chart has had several big moves up and down over the past 2 months. It is oscillating above and below last year’s close. The bears want a breakout below the February low. However, the year will probably end above the February low and below last year’s close.
The daily S&P 500 Emini futures candlestick chart has tested last year’s close repeatedly for the 1st 5 months of the year and for the past 2 months. The chart is telling us that traders are debating whether this year will have a small gain or loss.
When the Emini spends a lot of time around one price going into the end of the day, week, month, year, it often does not decide whether to close above or below the price until the very end.
I did not post a year chart. If I did, you would see that it has a small body. That is neutral. The Emini might wait for the last 1 – 2 trading days before making a quick move slightly above or below last year’s close.
How important is the close of 2018?
Does it matter if this year’s close is a little above or below last year’s close? It is a minor sign of strong bulls or strong bears. That means it does not have significant predictive power for next year. A close around the open of the year represents balance between the bulls and the bears. Traders will have to wait for 2019 before there are early clues that tell them if the next move will be up or down.
Everyone wants high probability bets. In a trading range, the market is neutral. Consequently, the bulls and bears have the same probability of a successful breakout. Until there is a breakout, traders will bet on reversals. Furthermore, they will take profits after 1 – 3 days. There is no evidence yet that this is changing.
The FOMC is a catalyst on Wednesday. But, last year’s close is more important. Consequently, even if there is a big move on Wednesday, it will probably not have more than a day of follow-through. The Emini will probably close the year above the February low and below last year’s close. Since it is now oversold and near the bottom of the range, it will probably bounce in the next 2 weeks.
Trading Room
Traders can see the end of the day bar-by-bar price action report by signing up for free at BrooksPriceAction.com. I talk about the detailed Emini price action real-time throughout the day in the BrooksPriceAction.com trading room. We offer a 2 day free trial.


