

The 30-year Treasury bond futures monthly chart is in a strong enough bear rally to test the 2017 lower high. The nested wedge top and the strong first leg down in 2016 make the rally likely to fail. The bond market will likely be in a bear trend for 20 years.
The U.S. Dollar monthly futures chart has rallied in 2018. But, the rally is at the top of a 15-year trading range. Trading ranges resist change and reversals are more common than breakouts. It will therefore likely reverse back down within the next 6 months.
The Emini selling this week was from bulls finally giving up. This is a major change in market psychology. The daily and weekly charts are now in a bear trend and no longer in a trading range.
When the bulls give up, there is usually at least a small second leg down. In addition, there are bull trend lines and measured move targets between 2,300 and 2,400. Support is a magnet. The strong momentum down makes lower prices likely.
Since there is a sell climax on the daily chart, the Emini might rally for a week or so. However, a bear flag is more likely than a bull trend reversal.
Monthly 30-year Bond futures candlestick chart:
Bear rally to double top lower high major trend reversal after wedge top
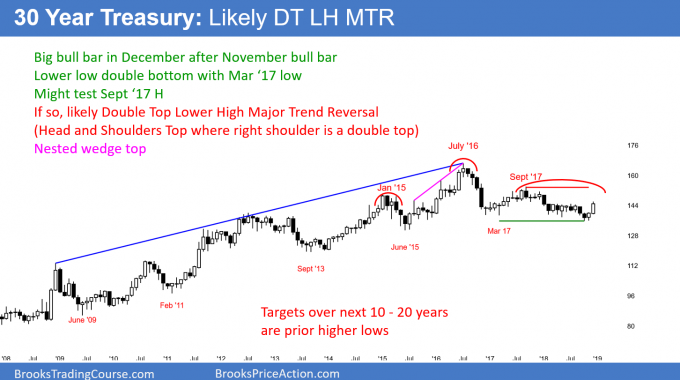
The monthly 30-year Treasury Bond futures candlestick chart has been in a trading range for 2 years after a massive nested wedge top. November was a buy signal bar for a lower low double bottom. December so far is a big bull bar. The rally will probably form a double top bear flag with the September 2017 lower high.
The 30-year Treasury Bond futures chart has been in a trading range for 2 years. This follows a 10-year nested wedge top. The selloff in 2016 was strong enough to have a 2nd leg down. While the selloff from the September 2017 high is a second leg down, it is probably not enough.
November was a buy signal bar for a lower low double bottom with the March 2017 low. The bulls see December as the entry bar for the breakout of that double bottom. They are hoping that it is a two-legged pullback from the wedge top. Obviously, they want the 20-year bull trend to resume.
However, a two-legged pullback from a wedge top usually has about half as many bars as there were in the wedge. When the pullback is much smaller, like the current one, it typically is a complex first leg down.
Consequently, the two-month rally is probably only part of a two-legged pullback (bear rally) from the first leg down in March 2017. Traders should expect the rally to fail around the September 2017 high. If there is a reversal down from there, the bears would have a double top bear flag. In addition, there would be a double top lower high major trend reversal.
A wedge top often has a strong bounce after the first leg down. If the bear trend resumes, that bounce is usually the right shoulder of a head and shoulders top. In this case, the left shoulder is the January 2015 high.
Most trend reversals fail, but not this one
Most major reversals fail. Most tops involve trading ranges in bull trends. Since markets have inertia, the odds favor a resumption of the bull trend.
Why is this top different? First, the nested wedge rally had a classic wedge shape. Next, the rally from the June 2015 higher low was climactic. Finally, the first leg down in late 2016 was remarkably strong. These factors make a second leg down likely.
The two legs down from the 2016 top are too small in terms of the number of bars and the depth of the selling to adequately relieve the buy climax. Consequently, the odds favor a second leg down over the next several years. A measured move down would be below 100 and test the 2011 higher low.
There is always a bull case. Without a strong break above the September 2017 right shoulder, the bulls have only a 40% chance of a new high before a bigger 2nd leg down.
Monthly US Dollar futures candlestick chart:
15-year trading range with head and shoulders bottom and double top
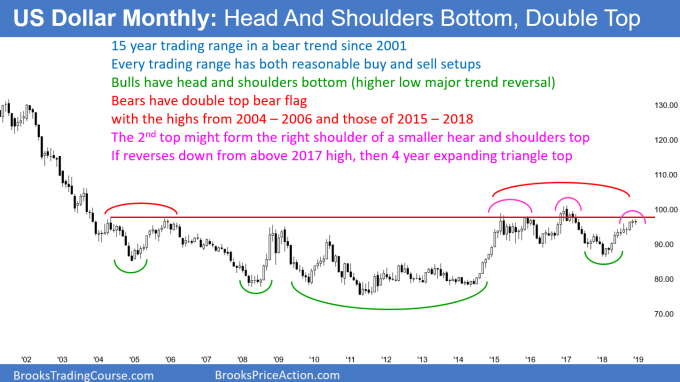
The monthly U.S. Dollar futures candlestick chart has been in a trading range for 15 years. It is therefore in breakout mode. A reversal down from here would create a four-year head and shoulders top and a 15- year double top. A selloff from above the 2017 high would form a four-year expanding triangle top. The bulls need consecutive closes above the 2017 high to shift the probability in favor of a successful breakout.
The U.S. Dollar monthly futures chart sold off strongly in 2001 and then entered a trading range for 15 years. This is a breakout mode pattern. Every trading range has both reasonable buy and sell setups. The bears want the 2018 rally to fail around 100 at the top of the 15-year range. A reversal down from the current level would create a four-year head and shoulders top.
If the bulls break above the trading range, but the breakout reverses down, there would be a four-year expanding triangle top. Traders would then look for at least a 10-bar selloff. Since this is a monthly chart, that would be about a year.
A break below the 2018 low would trigger a failed head and shoulders bottom. The bears would then hope for about a $10 measured move down to the bottom half of the 15-year range.
The bulls need two strong closes above the 2017 high before traders will believe that the bottom is in. If so, their goal would be a measured move up. Since the 15-year range is about $30 tall, the bulls would hope for a $25 – $30 rally back to the 2001 high.
How to trade the monthly chart
Traders do not trade the monthly chart. Investors make investments based on the chart. Traders are looking for moves that last minutes to weeks. If a trader is willing to hold a position for six months to years, he is then considered to be an investor and not a trader.
Most people reading this are traders. Consequently, they are simply looking for breakouts or reversals on the monthly chart but are entering on the daily or weekly charts. They plan to exit within a few days to a couple weeks. Then, they look for the next trade up or down.
Swings on the monthly chart can last for years. During those swings, there are always many good trades in the opposite direction on smaller time frame charts. That is the case here. While it is interesting to watch the monthly chart unfold, the monthly chart is for investors and not traders.
Monthly S&P500 Emini futures candlestick chart:
Sell vacuum test of bull trend lines
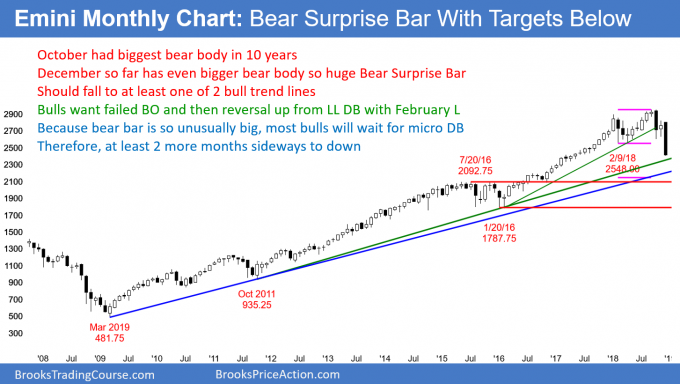
The monthly S&P 500 Emini futures candlestick chart so far has a huge bear body in December. The momentum down is likely to drive the monthly chart to at least one of the bull trend lines. The measured move target from the double top is at 2,146, which is just below both lines.
The monthly S&P 500 Emini futures candlestick chart has a huge bear bar with one week remaining. The big bear bars in October and December indicate strong momentum down. Consequently, most bulls will wait for at least a micro double bottom before betting that the selloff has ended. That typically would take at least two more months to form. There is currently a 70% chance of at least a break below the green trend line. I drew it using the October 2011 and January 2016 lows.
There is another less important bull trend line just below. The spacing between the first two points is small compared to that between the second and third points. When the shape is bad like this, fewer computers use it in their decision making.
2014 – 2015 final bull flag?
The Emini began a strong bull trend in January 2016. The two-year rally was in a tight bull channel. In fact, until January 2018, there was a 15 bar bull micro channel. That was the most extreme buy climax in the 100-year history of the stock market. That is why I said in January that at least 5% – 10% correction was imminent.
I also wrote many times during the two-year buy climax that the odds were at least 60% that the rally would ultimately reverse down to 1,800 at the bottom of the 2014 – 2015 range. I said that it might take five years to achieve the goal, but that two-year range was a strong magnet. It held the Emini in a tight range for two years. Since it formed late in a bull trend, it was a good candidate for the final bull flag. Its low around 1,800 is the typical goal for the reversal down.
Magnet at bottom of 2016 – 2017 buy climax
The bottom of the final bear flag is also the bottom of the 2016 – 2107 buy climax. When a buy climax reverses strongly like this one is doing, the bears try to get all of the way to the start of the buy climax. That is the January 2016 low just below 1,800.
That would totally erase all of the gains of the Trump years. Since markets are the alpha male of capitalism, they tend to humble everyone. This especially includes a president who implies that he can control the market and make it go up, unlike anyone else.
Prior to December, the Emini was likely to have one more new high before reversing down. If December closes on its low, it will close around the midpoint of the 2016 – 2017 buy climax. The momentum down will make it more likely to continue down to the 1,800 buy climax low before making a new high.
If December rallies this week and puts a prominent tail on the bottom of the December candlestick, or if January is a big bull bar, the odd will favor a new high before a test of 1,800.
Can the bear breakout fail?
When there is a strong bear breakout, everyone believes that the Emini will continue to fall at least a little lower. This is especially true because of the magnetic pull of the bull trend lines and the measured move target below.
However, experienced traders know that when something is obvious, the exact opposite is more likely than what most traders believe.
Currently, the bulls have only a 30% chance that December will be the low of the correction. But, if January is a bull bar closing near its high, the probability of a failed bear breakout will rise to 40%. This is particularly true if January is a big bull bar closing near its high.
Weekly S&P 500 Emini futures candlestick chart:
Emini bear surprise bar breakout below 2018 head and shoulders top
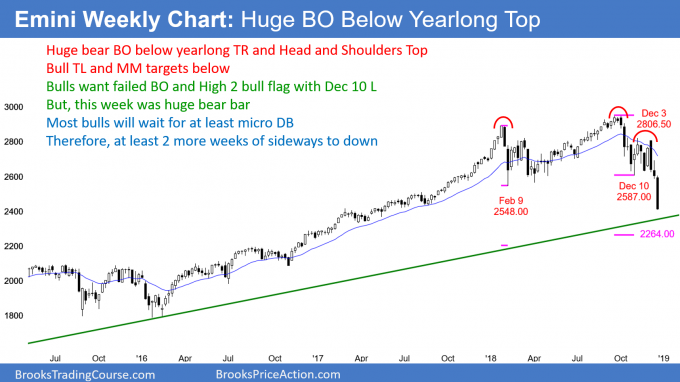
The weekly S&P 500 Emini futures candlestick chart formed a huge bear bar last week (ending Dec. 21). It is a breakout below the neckline of a head and shoulders top.
The weekly S&P 500 Emini futures candlestick chart broke strongly below a 50 bar trading range after a 500 bar (10-year) buy climax. The bear candlestick was unusually big and unexpected. It is therefore a bear surprise bar, which has a 60% chance of at least a small second leg sideways to down. There is a 30% chance of a 3 – 5 bar bounce before the second leg down begins.
The surprise bar represents a change in perspective. The bulls last week had become desperate and were selling out at any price. They were giving up (the surprise bar here is also a give up bar). They did not want to wait for a rally to sell because they were afraid that the rally might come from much further down and not get back to the current level.
The bears became much more aggressive. There were selling at the market and at the low. This is because they are now confident that one of two things will happen. Either the selloff will continue and they can take profits. Or, there will be a minor reversal up. They would sell more, confident that there would be at least a test of the prior low.
This would allow them to get out of their first short at around breakeven. They could also exit their higher short with a profit.
Head and shoulders top and lower high major trend reversal
Some traders will call the December 3 high the right shoulder of a head and shoulders top. Others will think of it as a lower high major trend reversal.
More important than the name is the size of this week’s bear breakout. The bigger a breakout bar is and the more it closes on its low, the more likely the selloff will fall for about a measured move down. There is currently about a 60% chance reaching at least around 2,300. That is also near the monthly bull trend line.
There are always multiple ways to draw measured move projections. A popular approach is to use the highest and lowest points in the range, or any major high with any major low. No matter how a trader draws his lines, the target is between 2,200 and 2,300.
Will the bulls reverse the sell climax this week?
This week is the second leg down from the September high. Swings in a trading range often end after a second leg down. The first leg down was the October low. If the three-month selloff is simply a bear leg in what will become a big trading range, the bulls will probably get a reversal this week.
However, because this past week was so unusually big, the bulls will see several consecutive bull bars to reverse the selloff. A single strong bull bar will probably be a pullback. The bear trend would then reverse within a few weeks.
Second leg bear trap
When there is a huge bear bar in a second leg down, the bulls have a 40% chance of a second leg bear trap. Bears often see the huge bar as a great opportunity to take partial profits. Their protective stop is far above. They therefore have big risk. Their risk managers will force them to reduce the risk.
The easiest way is to buy back part of their shorts. The bulls know this and often buy the close of a big bear bar in a second leg down, hoping for a rally for a few days. Therefore, there is an increased chance that the bulls and bears might buy the open on Monday (Dec. 24). This could lead to several days of higher prices.
But, unless the bulls get several consecutive bull trend bars, the odds are that any rally will be a bear flag. Lower prices are likely.
Daily S&P 500 Emini futures candlestick chart:
Sell climax just above measured move target
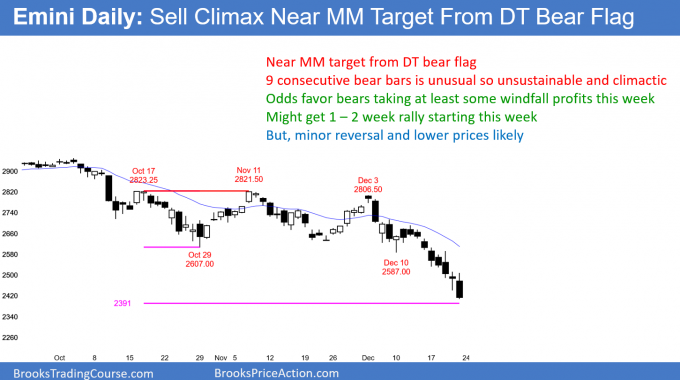
The daily S&P 500 Emini futures candlestick chart is in a strong bear breakout. There have been nine consecutive bear bars, which is unsustainable and climactic. There will probably be a bounce this week from the measured move projection based on the October/November double top bear flag.
The daily S&P 500 Emini futures candlestick chart is accelerating down in its bear trend. However, nine consecutive bear trend bars is very unusual. There will therefore probably be at least one bull bar this week. If the bulls get a micro double bottom, they could begin a rally that could last a week or two.
Whenever a market is in an unusual streak like this, it is unsustainable. It is therefore a sell climax. In addition, Friday (Dec. 21) had the biggest bear body of the none-day streak. That is a sell climax within the none-day sell climax.
A sell climax attracts profit-taking by the bears and buying by aggressive bulls. That is what is likely for at least a few days over the next two weeks.
Finally, the Emini is at the end of the month and the end of the year. The monthly and yearly charts are now at their extreme lows. Most big bear bars do not close on their extreme lows. That increases the chance of at least a 20 – 50 point rally above the low of the year before the end of December.
Only minor reversal up
The first rally after a sell climax is often strong enough to make traders wonder if the trend is reversing. There are often 2 – 3 consecutive big bull days closing near their highs. In addition, there is frequently a second leg up.
But, when the bear channel is tight like this, the first reversal up has only a 30% chance of ending the bear trend. Instead, it has a 70% chance of being either a bear flag or a bull leg in what will become a trading range.
The bulls will take quick profits around the resistance of the EMA, the top of the nine-day bear breakout, and the breakout point. Different computers will consider the October low, the February low, or the December 10 low as the most important point. It does not matter. They are all around 2,600. If there is a 1 – 2 week rally, the bears will look to sell there.
Trading Room
Traders can see the end of the day bar-by-bar price action report by signing up for free at BrooksPriceAction.com. I talk about the detailed Emini price action real-time throughout the day in the BrooksPriceAction.com trading room. We offer a 2-day free trial.


