

Last week was a rough one for the broad-equity benchmarks. It was particularly brutal for shipping giant FedEx. On Dec. 19, the stock saw its biggest daily percentage drop in a decade after taking a hatchet to its fiscal 2019 profit forecast, says Bernie Schaeffer.
The news caused a ripple effect across the transports sector, as FedEx (FDX) CEO Alan Graf warned, “Global trade has slowed in recent months, and leading indicators point to ongoing deceleration.”
With FDX as its top holding, the iShares Transportation Average ETF (IYT) felt the pain, too. By the end of the day on Wednesday, IYT was in official bear-market territory, down more than 20% from its mid-September closing high.
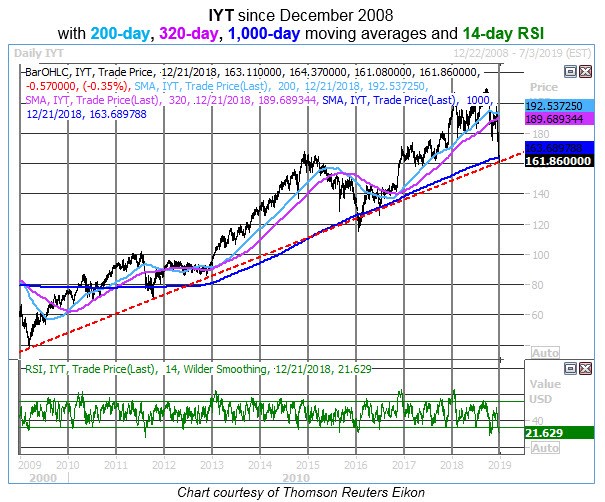
Plus, IYT wrapped up the week by closing two consecutive sessions beneath its 1,000-day moving average for the first time in over two years. This longer-term moving average is one of those under-the-radar technical levels we often like to track in our research, and the historical significance of the 1,000-day for IYT had been flagged by Schaeffer’s Quantitative Analyst Chris Prybal just ahead of Thursday's closing break.
Looking back over the past eight years or so, there have been only a few previous examples of IYT diving below its 1,000-day moving average while simultaneously trading below both its 200-day and 320-day trendlines, as it is now. The prior occurrences in 2011 and 2016 coincided with extremely oversold readings from the exchange-traded fund's (ETF) 14-day Relative Strength Index (RSI) -- and those breaks below the 1,000-day were relatively brief, lasting anywhere from just two days (around the time of the June 2016 Brexit vote) to just under two months (mid-August to early October 2011, and early January to mid-February 2016).
As of the end of last week, with its 1,000-day moving average now overhead, IYT was testing another possible layer of support at a rising trendline connecting a series of higher lows going back to its March 2009 bear-market bottom (represented by the red dashed line on the accompanying chart).
However, support here is hardly foolproof; a successful test of this foothold on Thursday gave way to a break on Friday, and back in January 2016, selling pressure was heavy enough that the shares barely paused at this trendline before eventually bottoming around $115.
Late in the third quarter, we spoke about the exhaustion in the transports rally as a red flag for stocks. With that prospective canary in the coal mine scenario having since played out in about the grimmest possible fashion, we’d advise you in the weeks ahead to pay close attention to IYT's next moves around these longer-term trendlines (a technical trial that's largely escaping the notice of the financial media).
A continued slice below these levels could foretell more pain and selling to come for stocks, while an oversold bounce back above -- and subsequent hold of -- these support layers would provide some cause to anticipate a period of short-term stabilization.
Subscribers to Bernie Schaeffer's Chart of the Week received this commentary on Sunday, December 23.
View Schaeffer’s Investment Research for stock and options ideas, options education, and market commentary here
Todd Salamone of Schaeffer’s Investment Research: How to trade options like the pros in a webinar here.
Recorded: TradersExpo Las Vegas, Nov. 13, 2018.
Duration: 49:23.


