

For now, continue to use call and put options in lieu of buying stock or shorting stock during this time of heightened uncertainty and volatility, writes Todd Salamone Monday. Todd Salamone of Schaeffer's is presenting at MoneyShow Orlando.
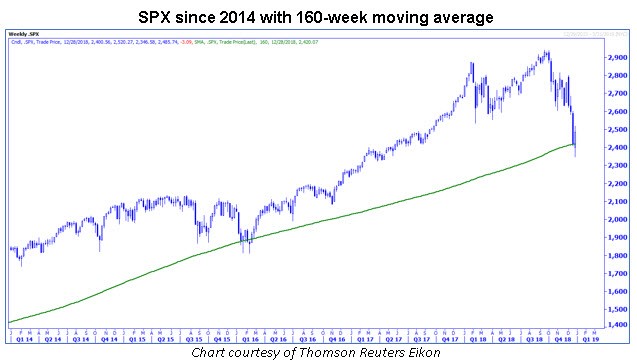
“If you're a long-term investor, and have stayed pat, you're hoping that this is 1987, 1990, 2011, or 2016, when the decline to the 160-week moving average was the end of 'it.'... A weekly SPX close that is significantly below the 160-week moving average should be the first warning of prolonged, serious downside to come in the months ahead.”
Monday Morning Outlook, December 24, 2018
Last week's stock market action -- including a phenomenal reversal from the Thursday lows -- gave bulls hope that it is indeed the end of it with regards to the heavy selling that has taken place not only this month, but since equities peaked in September.
After a Christmas Eve that bulls would just as soon forget, the S&P 500 Index (SPX - 2,485.74) came roaring back to close the week above its 160-week moving average, which is located at 2,420.07.
It wasn't looking so promising on Monday, however, as the SPX closed at 2,351.10 -- less than 7 points above 2,344.60, a level that is a round 20% below September's all-time closing high.
In other words, to those who use a 20% decline from a peak to call it a bear market, the SPX narrowly escaped this characterization. The SPDR S&P 500 ETF Trust (SPY - 247.75) closed Monday at $234.34, south of the $234.86 level that is 20% below its September closing high.
Whether we entered a bear market or not can be debated. But what cannot be debated is that on a weekly closing basis, both the SPX and SPY closed above their respective 160-week moving averages. This does not necessarily mean that the bottom is in, but it does suggest that longer-term investors do not have to look for an exit point, at least for the time being.
And, even as the bear market is being tossed around on TV and in newspapers, the action last week may prove to be a buying opportunity if the bottoming process is like that of 1987, 1990, 2011 and 2016, which I discussed last week with accompanying visuals of 2011 and 2016. In those four years, there were retests of the lows as the bottoming process took place over a period of weeks.
While bulls hope a bottom is in and a V-rally is on the horizon, there are multiple resistance levels overhead that could be viewed as potential hesitation points if last week’s rally continues. Or, these levels could be short-term pivot points that mark highs before the SPX heads south again toward last week's lows.
The first significant resistance area is at 2,507 -- the SPX close the day of the Dec. 19 Federal Open Market Committee (FOMC) rate hike. The second resistance level is at 2,546 -- the close one day prior to the hike. During the current tightening cycle, the SPX has typically run into resistance around closing levels the day before or the day of the meeting.
Amid the day-to-day volatility that has seen the SPX move in 100-plus point ranges, suffice it to say that an area of strong potential resistance is between the 2,500 century mark and the 2,550 half-century mark (Friday's high was 2,520).
The SPX’s half-century 2,350 level marked last week’s low and is therefore a potential -- if not critical -- support level for bulls if a pullback is on the immediate horizon.
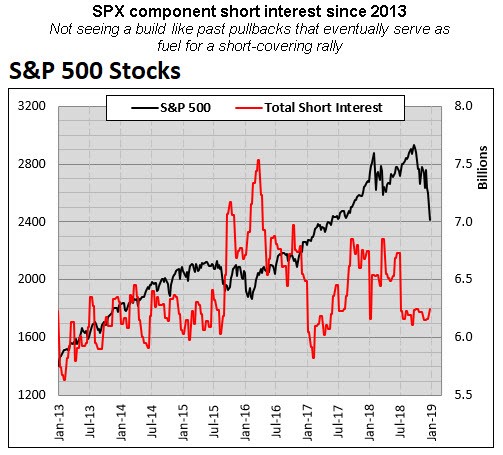
The shorts could create a headwind for equities as they try to build on last week's rally. Short interest data as of Dec. 15 was released last week and again, to my surprise, there was not a noticeable build-up of short positions on SPX component names, which I found unusual in the context of what has transpired since September. A concern for bulls is that the shorts could be looking for more ideal entry points, and thus use rallies to initiate new positions.
While it was encouraging that the SPX found support at a trendline that has historically marked bottoms, the bulls are not out of the woods. Strong resistance levels remain overhead, including the area between 2,500 and 2,550, plus prior 2018 lows just below the 2,600 century mark. The CBOE Volatility Index (VIX - 28.34) closed below 32.08 -- double 2017's closing high -- and 32.55, which is triple the August closing low. If the VIX moves back above this area, the odds favor stocks breaking below last week's lows.
For now, continue to use call and put options in lieu of buying stock or shorting stock during this time of heightened uncertainty and volatility. We certainly look forward to helping you navigate both the risks and the opportunities as they appear in the coming months, and wish you a safe and happy 2019.
Continue reading:
- Indicator of the Week: 30 Stocks Set to Spike the First Week of 2019
- The Week Ahead: Powell, Jobs Report Top Focus for New Year's Week
View Schaeffer’s Investment Research for stock and options ideas, options education, and market commentary here
Todd Salamone of Schaeffer’s Investment Research: How to trade options like the pros in a webinar here.
Recorded: TradersExpo Las Vegas, Nov. 13, 2018.
Duration: 49:23.


