

The Emini reversed up strongly over the past 2 weeks. On December 24, I said that there would probably be a rally that would be strong enough to make traders wonder if the bull trend has resumed, says Dr. Al Brooks. He's presenting at MoneyShow Orlando Feb. 8.
The rally probably will go higher, but it is still likely just a strong bull leg in what will become a trading range.
The crude oil daily chart has a weak bear rally. However, the downside is minimal because the bears are exhausted. The chart will probably be in a trading range for at least a couple months.
The 30-year bond futures chart has a parabolic wedge buy climax. There will probably be at least a couple legs sideways to down over the next 2 weeks.
Crude oil Futures market:
20 Gap Bar sell signal after weak Final Bear Flag rally
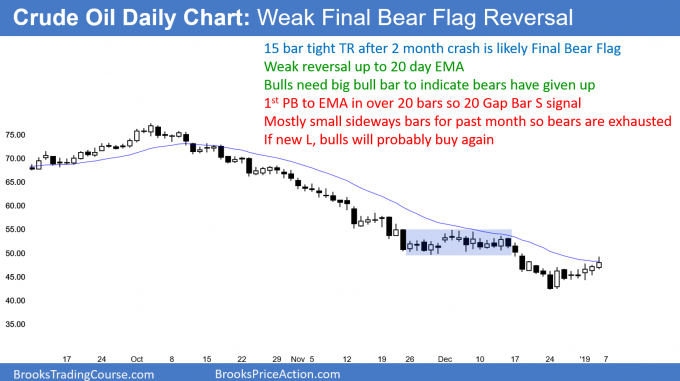
The crude oil futures daily chart is in a strong bear trend. The 2-week rally has been weak. This is the first pullback to the 20-day EMA, which means it is a 20 Gap Bar sell setup. The bulls need a big bull bar to indicate that the bears have given up. The bears are still in control, despite the possible Final Bear Flag.
The crude oil futures daily chart has a 20 Gap Bar sell setup. But, the bears want a bear bar closing near is low for a sell signal bar. Without that, the bear rally will continue.
If the bulls get a big bull bar closing near its high and far above the EMA, it would indicate that the bears have given up. It would likely lead to at least 2 legs up to around the top of the early December tight trading range. That trading range is late in a bear trend. It therefore is a good candidate for a Final Bear Flag reversal.
Minor reversal and trading range likely
Even if the bulls get their reversal, the 3 month bear channel has been tight. Consequently, the 1st reversal up will be minor. This means that it will lead to a trading range and not a bull trend.
If the 20 Gap Bar sell signal triggers, the target is a test of the low. Since the bear trend has lost momentum, there will probably be buyers below the December low. A reversal up at that point would create a wedge bottom with the November and December lows.
Despite the strong bear trend, this selloff is climactic. As a result, there is probably not much downside risk over the next couple of months. A trading range is likely to form because the bears are exhausted and less willing to sell at this low price.
US 30-year Bond futures candlestick chart:
Parabolic wedge buy climax
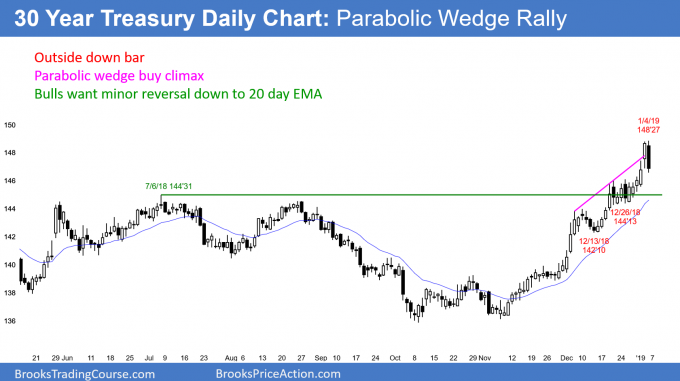
Friday was an outside down bar that closed near its low. It is a sell signal bar for a reversal down from a parabolic wedge buy climax.
The U.S. 30-year Treasury Bond future chart has rallied strongly for 2 months in a tight bull channel. Because the channel has 3 legs, it is a parabolic wedge buy climax. A trend like this is unsustainable.
The stop for the bulls is too far below. They therefore are risking more open profit than they typically do. As a result, they will take profits.
When they take profits, they will not look to buy again just 2 – 3 days later. A reasonable minimum goal is TBTL (ten bars, two legs) down to the 20-day EMA. Also, the reversal usually reaches either of the 2 higher lows. Then, the chart evolves into a trading range for the next 20 or so bars.
Outside down sell signal bar
Friday’s outside down candlestick is a sell signal bar. It represents bulls giving up. Bears will sell on a stop below its low. Their protective stop is above Friday’s high. If they get stopped out, they will sell the next reversal down as well if it comes within a few bars after the new high.
The odds are that the daily chart will trade sideways to down for at least a couple weeks. However, the tight bull channel means that the bulls are strong. Therefore, the selloff will probably be a minor reversal. This means it will lead to a trading range, not a bear trend.
Monthly S&P 500 Emini futures candlestick chart:
Bull inside bar after December sell climax
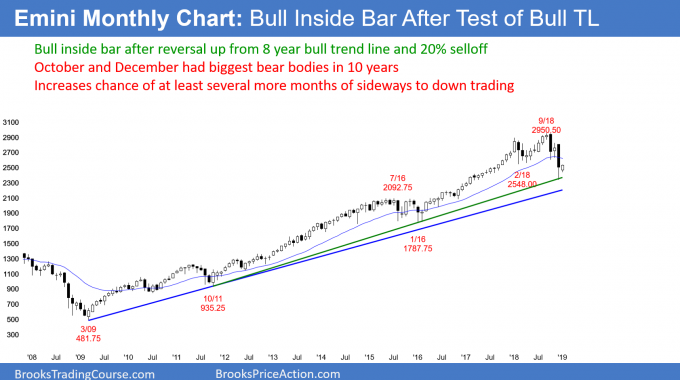
The monthly S&P 500 Emini futures candlestick chart has a small inside bar so far in January. Last month bounced from the 8-year bull trend line and a 20% correction.
The monthly S&P 500 Emini futures candlestick chart has traded in a narrow range so far in January. Last month bounced from both a 20% correction and an 8-year bull trend line. However, December had the biggest bear body in the 10-year bull trend. In addition, it closed below the 2018 trading range. Finally, it was the third bar in a big, fast correction down from the all-time high. The momentum down is strong enough to make lower prices likely.
Whenever there is a breakout, the next month is important. January is the follow-through bar. It can help predict what traders can expect over the following months.
Bear case: strong January selling, confirmed bear breakout
If the candlestick in January is a big bear trend bar closing on its low, that would signify strong follow-through selling. The bears currently have a 30% chance of this outcome. It would make lower prices likely. The Emini would probably then fall to the next support level, which is the 2,100 top of the 2014 – 2015 trading range.
That trading range is a good candidate for a Final Bull Flag. If the Emini reaches its top, it will probably continue to its bottom at around 1,800. That would be about a 40% correction.
Bull case: strong January rally, failed bear breakout
The bulls want January to form a big bull trend bar closing on its high. If they succeed, January would become a buy signal bar for February. Traders would suspect that the December bear breakout failed.
They would then look for a strong rally in February. If that were to happen, then December would likely be the end of the selloff. Traders would expect a new all-time high within a few months. There is a 20% chance of this at the moment.
Neutral case: Neutral January, need more information
Finally, if January is unclear, traders would expect more sideways trading in February. For example, if January remains inside of December’s range and the candlestick has a small body with prominent tails, traders will need more information. This is the most common situation after a breakout.
“The nail that sticks out gets hammered down”
The market is the financial king of everyone. It is strong enough to humble everyone else. If there is a prominent figure who claims to have power over the market, the market enjoys hammering that person down.
Before he was elected, Trump claimed that he had the power to make the stock market rally. It rallied during his first year, and he claimed that he created the rally. Did he? Nope. Did he cause the 20% correction? Nope.
However, I have been doing this for over 30 years. Markets are drawn to stops and tend to go beyond them. Stops are magnets. I said many times in late 2017 that the 2017 buy climax was the most extreme in the 100-year history of the stock market. When there is a reversal down from an extreme buy climax, the selloff typically reaches the bottom of the buy climax. December fell below August 2017 start of the buy climax.
The rally from the 2016 election to January 2018 was a even bigger buy climax. Although 2016 was not as extreme as 2017, the entire 2 years was a buy climax. That means that there is a Trump magnet at around 2,120 in the Emini.
The stock market began its extreme buy climax at his election. Because the first half of the 2-year buy climax was less extreme, its low is less important. But, the market tends to hammer the nail that sticks out. Therefore, there is a 40% chance that this selloff will hammer Trump’s rally down to nothing before it is done.
Weekly S&P500 Emini futures candlestick chart:
Bull trend reversal triggered this week
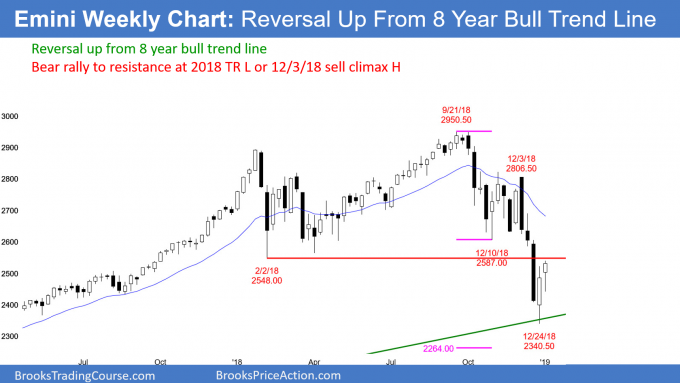
The weekly S&P 500 Emini futures candlestick chart closed near its high and above last week’s high. It therefore triggered a weekly buy signal for a reversal up from an 8-year bull trend line.
The weekly S&P 500 Emini futures candlestick chart broke strongly below a 50-bar trading range in December. All of the bulls who bought stock in 2018 are now holding losing positions. They are worried about the size of the 3-week collapse. Therefore, many are looking to exit with a smaller loss on a bounce to the bottom of the yearlong trading range.
Their stock waiting to be sold represents supply and therefore creates resistance. That is around the February or November lows and the 2,600 Big Round Number.
The bears know that the bulls are trapped. They, too, will look to sell at that test of resistance, believing that the supply is too much to overcome.
Additionally, many bears took profits on the collapse to the monthly bull trend line. Their protective stops were so far above that their risk had become too great. Risk management dictated that they reduce their positions.
However, they are still eager to sell a rally up to resistance, which is exactly where the bulls will dump their losing longs. Consequently, there will probably be a 2nd leg down from around 2,550 or 2,600.
Measured move down?
Whenever there is a strong break below a trading range, traders begin to consider a measured move down. The 2018 trading range was 400 points tall. Therefore, a measured move down is around 2,150. That is also around the top of the 2014 – 2015 trading range. In addition, it is at the Trump magnet as well (see above). That cluster of support increases the magnetic pull of that level.
Finally, of the 32 times in the past 100 years that the market fell 20%, none fell exactly 20%. All fell more. The average was about 30%. A 30% selloff would be below 2,100, which is again in that same area. Therefore, if the Emini continues down, it will probably reach that support zone.
Daily S&P 500 Emini futures candlestick chart:
Strong Emini rally testing February and October lows
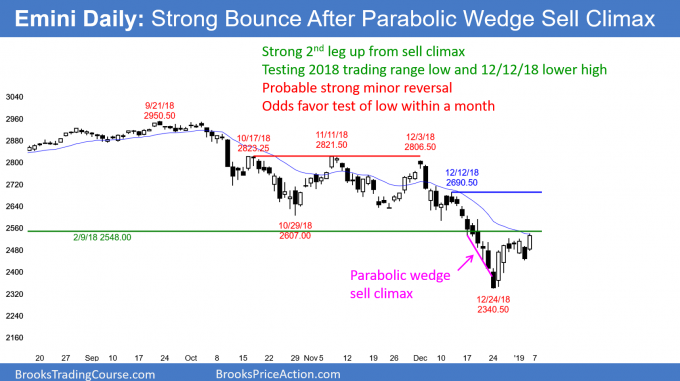
The daily S&P 500 Emini futures candlestick chart reversed up sharply from yesterday’s higher low. It is now just below the February low and the 20-day EMA.
The daily S&P 500 Emini futures candlestick chart sold off for 10 consecutive days in December. This had never happened in the 20-year history of the Emini, and possibly the 100- year history of the S&P. It is therefore the most extreme sell climax, at least by this measure, in history.
Extreme climaxes usually lead to big reversals. Look at my reports in late 2017. I repeatedly warned that the daily, weekly and monthly charts were all in the most extreme buy climaxes in history. Furthermore, I said that they would probably have a deeper correction than what any pundit on TV was saying at the time.
The current rally has been very strong. It has retraced about half of the December crash. It is now just below the 20-day EMA and the February low.
The goal of price action
Every market constantly searches for a trading range. That is a price that both the bulls and bears feel is fair. The market typically has to go too far up and down to discover how far is far enough. The December crash and the January reversal are examples.
I wrote on December 24 that the Emini was probably going to reverse up within a day. I said that because the crash was the most extreme sell climax in history and it poked just below the 8-year bull trend line. Every bear trend ends at a bull trend line. Traders know that, and therefore the selloff might have been simply a sell vacuum test of support. In addition, I said that the rally would be strong enough to make traders wonder if the bear trend had ended. That is what is taking place today.
Difference between a major and minor trend reversal
A major trend reversal means a bear trend becomes a bull trend. A minor is more common. It means that there is a rally up, but it becomes either a bear flag or a bull leg in what will become a trading range. Once in a trading range, the bulls will have a 40% chance of a major trend reversal.
Minor reversal is more likely
Well, has the bull trend resumed? Probably not. There are several reasons for this. First, the bear breakout went far below the 2018 trading range. Everyone who bought in 2018 is now holding a losing position. Many will sell out of their longs on the current rally, hoping for a smaller loss. This means that there is a lot of supply above.
Next, the bear channel in December was tight. There is only a 30% chance that a strong reversal up from a tight bear channel will immediately become a bull trend. Most traders want to see a test of the low. If there is a reversal up at that point, the bulls will have a 40% chance of a major trend reversal into a bull trend. There would still be a 60% chance of a trading range or a resumption of the bear trend.
Finally, traders are scared. Big bars and big reversals make traders quick to take profits. They are unwilling to buy too high or sell too low because they sense the probability of a trend is low.
Also, the big moves mean that the stops are far. That means the risk is big. The result is that traders buy low, sell high, and take quick profits. This creates a trading range. Consequently, a trading range is more likely over the next few weeks than a bull trend.
Where do rallies from sell climaxes end?
My first goal for a rally after a sell climax is the top of the most recent sell climax. That is top of the December 19 outside down bar.
The selloff was a parabolic bear channel. When a channel reverses, the rally often reaches the start of the channel. Here, that is the December 12 high, just below 2700. Furthermore, it is around the 20-week EMA.
Finally, it is around a measured move up from the low to last week’s high. Last week closed above last week’s high. As a result, there is a gap between last week’s close and that high. That increases the chance of a measuring gap and a rally to the start of the parabolic wedge bear channel.
However, that would require a huge rally. In addition, it is above the resistance of the February and October lows. If the Emini is to get there, it will probably have to test the December low first.
Trading Room
Traders can see the end of the day bar-by-bar price action report by signing up for free at BrooksPriceAction.com. I talk about the detailed Emini price action real-time throughout the day in the BrooksPriceAction.com trading room. We offer a 2-day free trial


