

An examination of Eurodollar Futures and Rates plus Treasury Yields indicate an inverted yield curve, says Paul Cretien.
One of the strongest signs of economic weakening and a precursor to a recession is when the yield curve inverts, i.e. short-term interest rate yield more than longer-term interest rates.
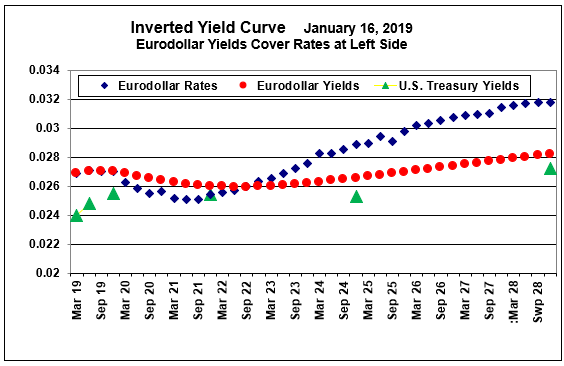
Typically analysts use the two-year/10-year interest rate spread, but there are fixed income durations from a few months to 30 years. The charts below show the U.S. Treasury yield curve with Eurodollar rates and yields on Sept. 18, 2017, and Jan.16, 2019. Probably the most important aspect of this illustration is that it shows the yield curve being inverted, with rates and yields declining rather than rising over a future period of approximately four years.
An inverted yield curve is generally caused by the Federal Reserve using higher short-term rates to cool off (that is, slow down) an overheated economy. Since the U.S. economy is currently positive, but not overheated with signs such as high inflation, the development of an inverted yield curve at this time is odd.
Some business enterprises will suffer from an inverted yield curve more than others. For example, banks depend on the spread between low cost rates on deposits and larger intermediate-term rates on bank loans for their basic income. An extended period of inverted yields will not be good for the banking business.
We will present further analysis of this next week.


