

Two key resistance levels are lining up this week in the S&P 500, according to Todd Salamone. He is presenting at MoneyShow Orlando.
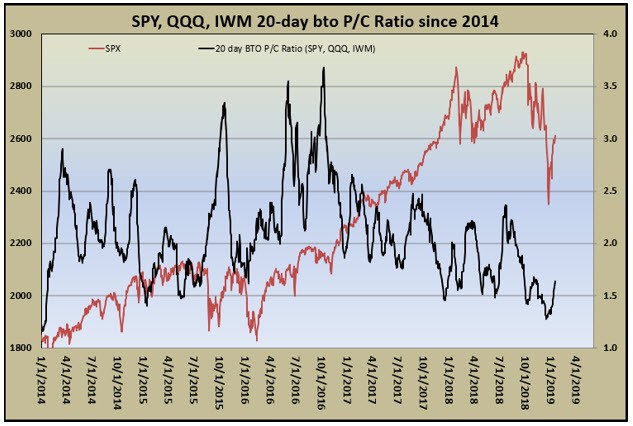
Last week, I talked about the possibility that hedge funds were likely moving back into the market, as SPX component short interest had not spiked very much in recent weeks. Moreover, put buying relative to call buying in broad-based equity exchange-traded funds (ETF) was picking up its pace, as evidenced by an increase in the 20-day buy-to-open put/call volume ratio for the SPDR S&P 500 ETF Trust (SPY), Invesco QQQ Trust (QQQ), and iShares Russell 2000 ETF (IWM), after a long period in which this ratio was declining swiftly.
When this ratio is declining, it signals potential long equity liquidations on the part of hedge funds, as the number of broad equity-based ETF puts purchased to protect long stock positions slows. But if SPY/QQQ/IWM put demand grows, it could signal hedge funds in equity accumulation mode. This ratio continues to advance from multi-year lows, a sign that under-invested hedge funds are likely in accumulation phase -- just as the retail investor hits the panic button.
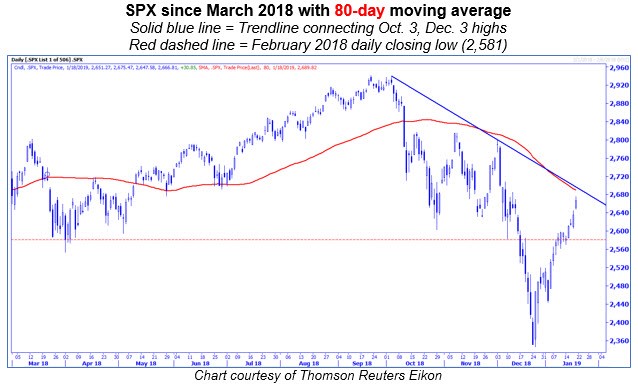
We noted last week that, "If we look beyond January expiration, there are multiple resistance levels overhead, which the SPX must overcome if it continues to make its way higher from the December lows. A major area to watch is between 2,650 (into the first week of February) and 2,690 (through Jan. 18), which represents potential trendline resistance when connecting the Oct. 3 peak with the Dec. 3 peak."
With the SPX approaching an overbought condition, according to its 14-day Relative Strength Index (RSI) of 62 (at Friday's close), it comes as no surprise that additional potential technical resistance levels are overhead.
There is a trendline connecting the Oct. 3 and Dec. 3 highs, which is most concerning (see chart below). It is declining daily and on Friday will be around 2,679. The 80-day moving average, which is in the vicinity of this trendline, is at 2,689. The 80-day moving average marked resistance in April and support in May and June, with moves below it in March and October 2018 signaling instability in the equity market looking out multiple weeks. If a retest of the December lows or the February lows of last year is in order, I would expect resistance in this area as the SPX moves into its first overbought condition since August-September.
The sentiment landscape discussed above is one that suggests the SPX can continue to take out resistance levels, as it has done in the past couple of weeks. Rallies may come at a slower pace, but there is fuel on the sidelines to support further advances in the equity market. That said, the Federal Reserve saying something that market participants don't like, or headlines on trade that conflict with the well-received reports from last week, are immediate risks to the rally.


