

The January Barometer states that the performance of the S&P 500 in January will predict its yearly performance, notes Kerry W. Given.
The S&P 500 Index (SPX) has traded higher since Dec. 26 and closed last week at 2707, up 2.3% for the week. Most of the last week of trading consisted of a sideways pause in this rally, but the last three days were very strong, including two gap openings higher (see chart).
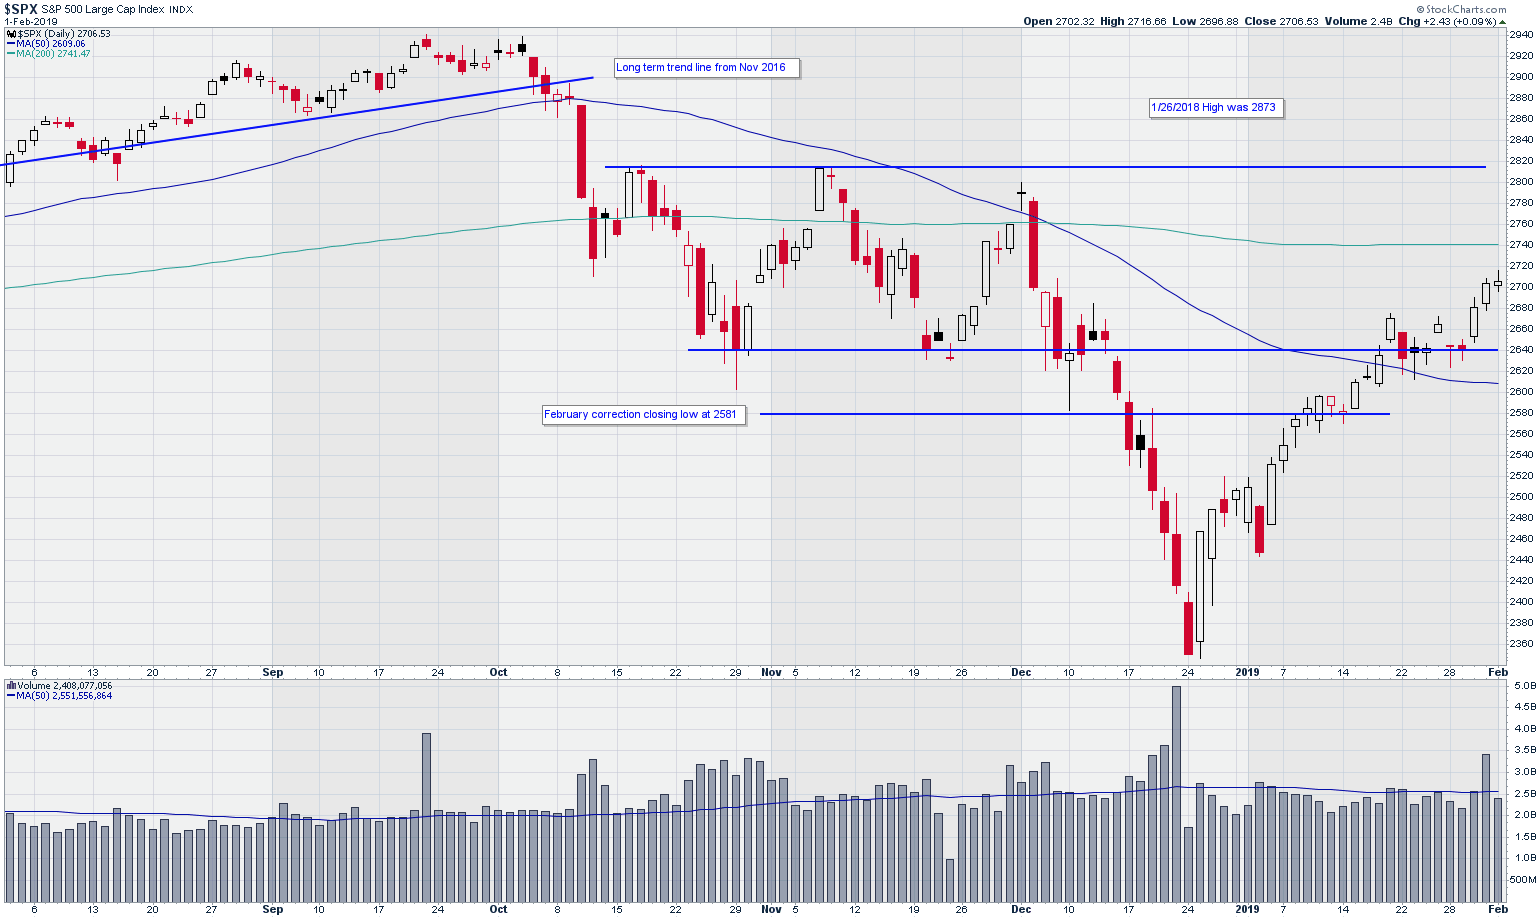
Standard and Poor’s 500 Index (SPX)
Chart courtesy of StockCharts.com
Trading volume in the S&P 500 remains below average, as it has since Dec. 26, the beginning of this bullish run. Volume only exceeded the 50-day moving average once last week. This suggests that the large institutions remain uncertain about this market.
Friday’s intraday high touched the upper edge of the Bollinger bands applied to SPX, and this may suggest a bit of a pause or breather this week.
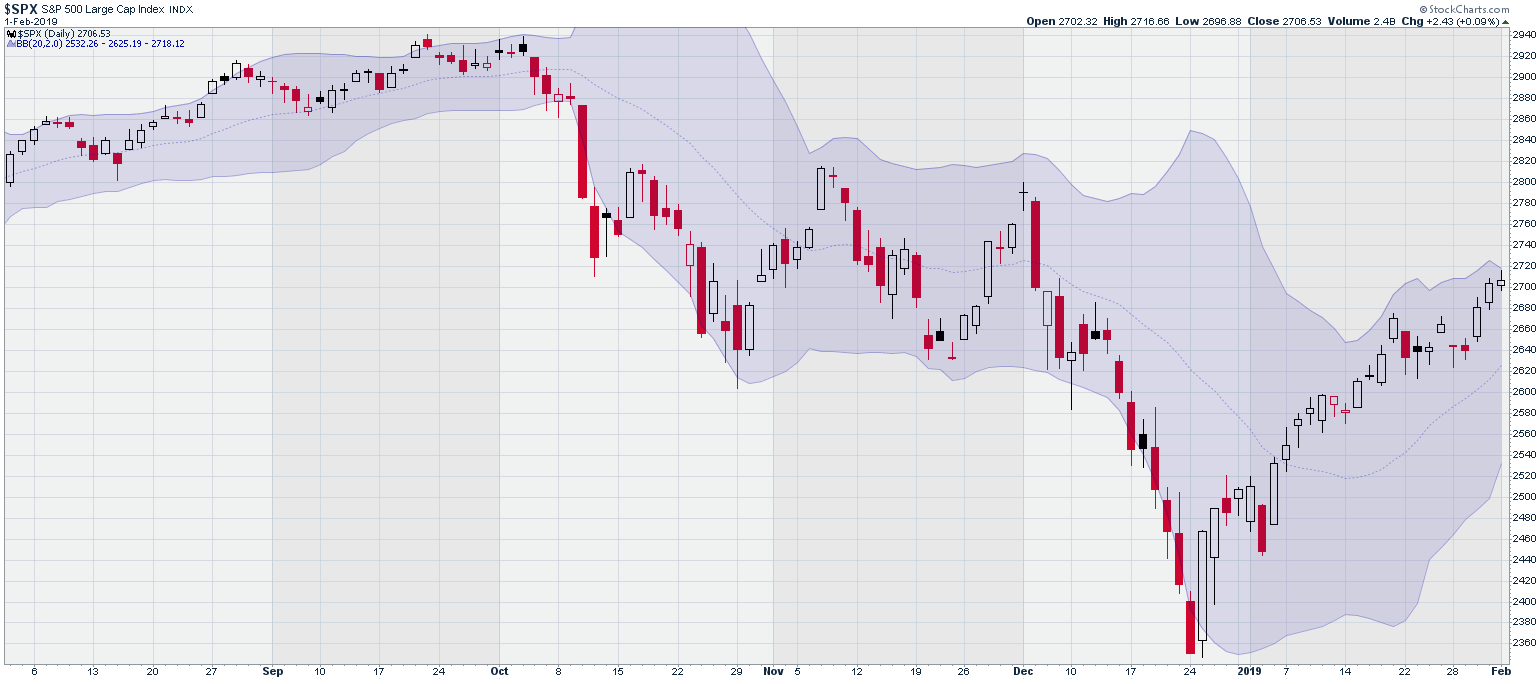
SPX with Bollinger Bands
Chart courtesy of StockCharts.com
Volatility, as measured by the CBOE volatility index (VIX) declined for the last three days, closing Friday at 16.1%. Typically15% as the borderline before I become concerned. By that standard, we should remain cautious.
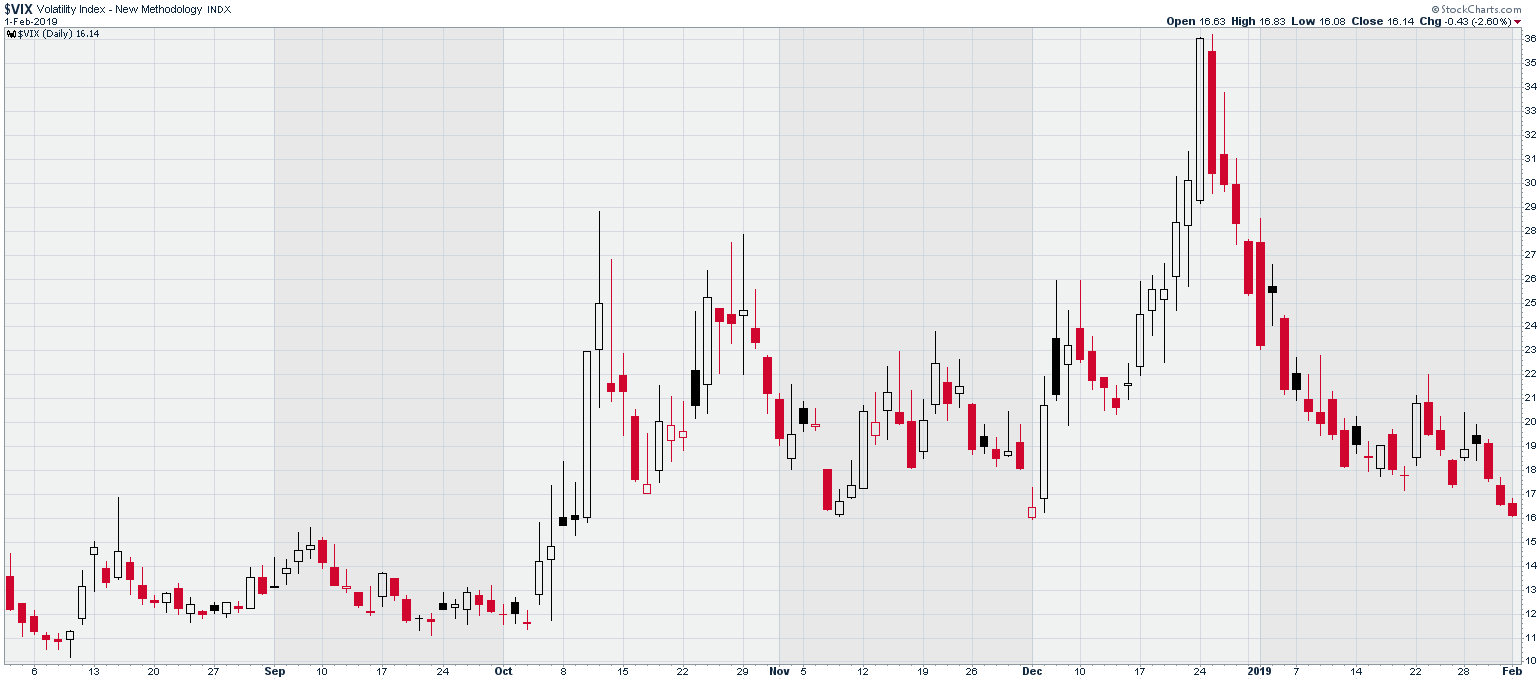
CBOE SPX Volatility Index (VIX)
Chart courtesy of StockCharts.com
The Russell 2000 Index (RUT) broke through the resistance set by the February correction low at 1464 on Friday, Jan. 25 and solidly stayed above that resistance level last week. Similar to the S&P 500, the Russell had positive days for the last three sessions, closing Friday at 1502, up 3 points.
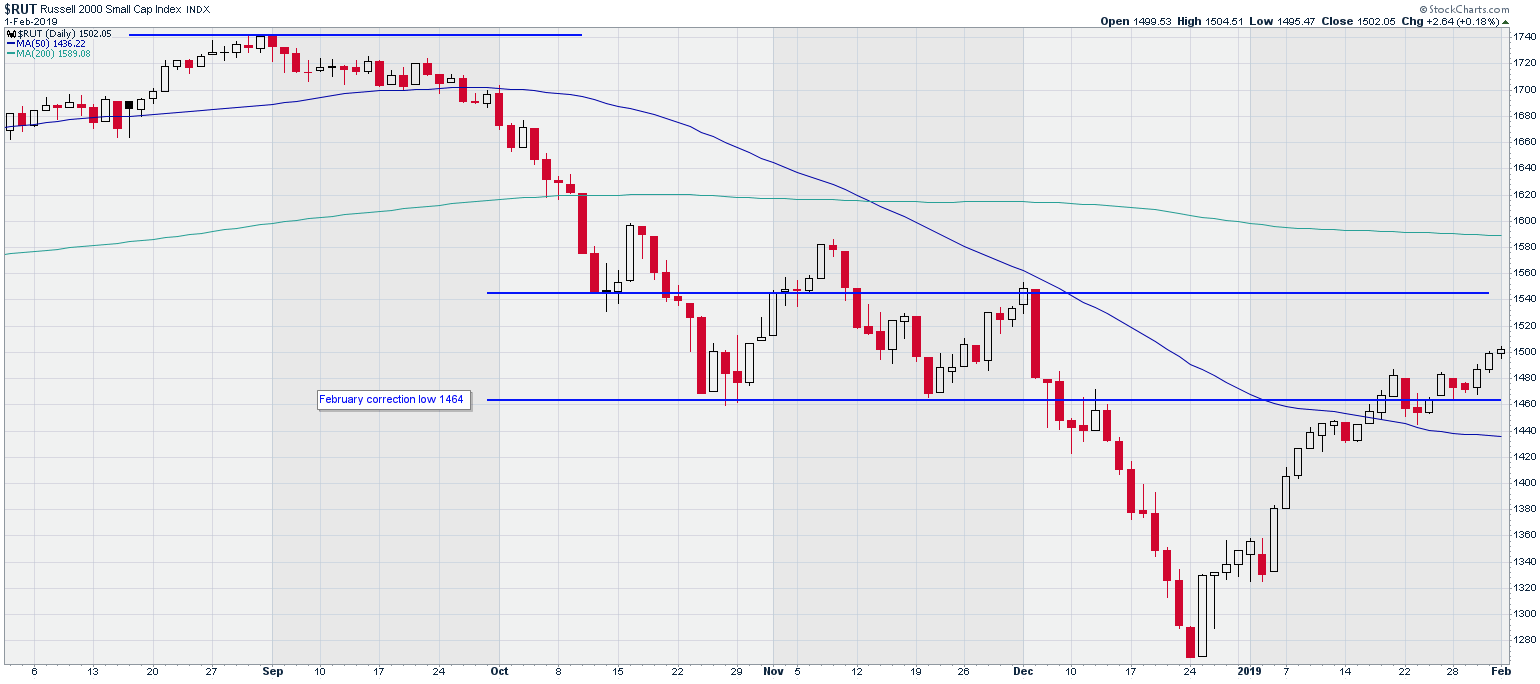
Russell 2000 Index (RUT)
Chart courtesy of StockCharts.com
The NASDAQ Composite Index traded higher on Wednesday and Thursday, but was held back Friday by Amazon (AMZN). Traders were disappointed with Amazon’s earnings announcement and weak forward guidance on Thursday evening. AMZN dropped $92, 5.4%, causing the NASDAQ to underperform other indexes.
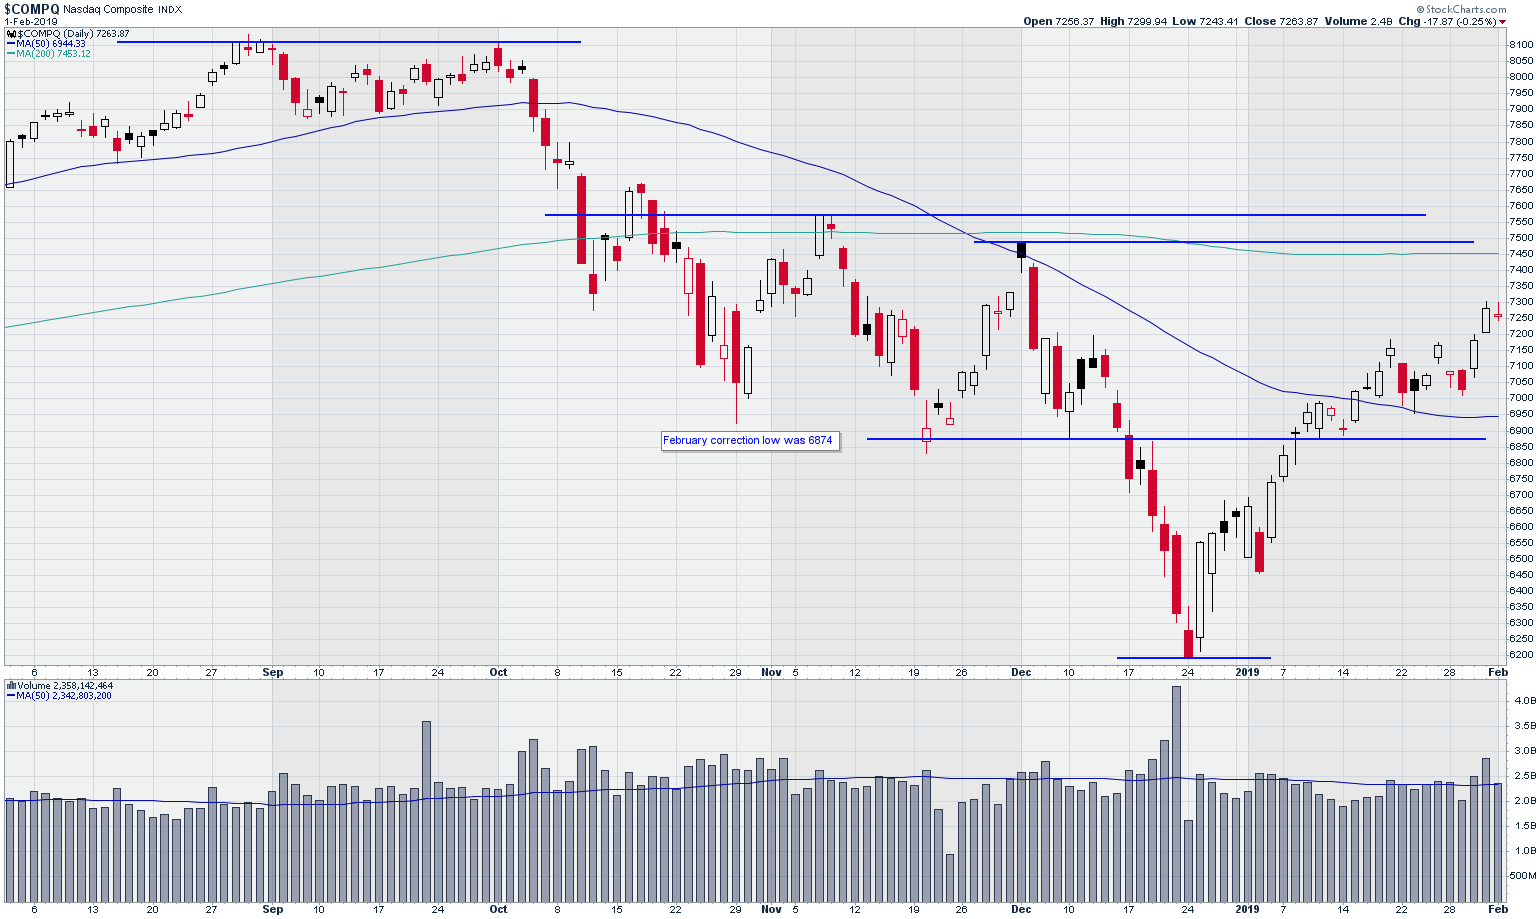
NASDAQ Composite Index
Chart courtesy of StockCharts.com
The market’s recovery since Dec. 26 has been impressive. The S&P 500 has gained 15%, but we should keep that gain in perspective. Today’s level is where the market was on Oct. 23, just before we tanked.
The January Barometer, developed by Yale Hirsch, has an 88% success rate since 1950. The January Barometer states that the performance of the S&P 500 in January will predict its yearly performance. The S&P 500 finished January 2019, 15% higher.
Traders should focus on stocks that have weathered the Q4 2018 storm well, and are now trading above their 50- and 200-day moving averages.


