

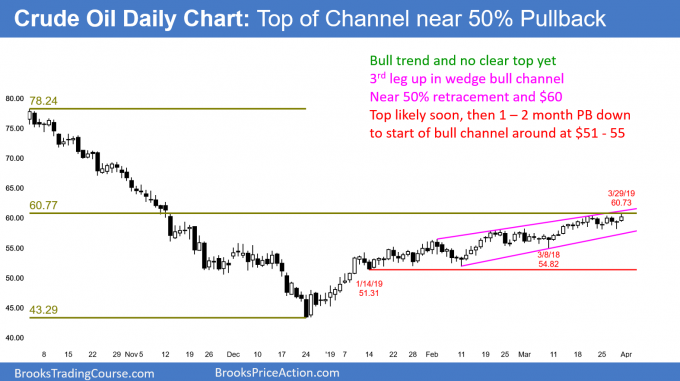
Crude oil futures show a Spike and Channel bull trend. There is no reversal yet and there are magnets above between $60 and $62. However, once the rally tests that resistance, crude oil will probably pull back to below $55 over the following month (see chart).
The rally to the Jan. 11 high is the spike. Once there was a pullback down to the Jan. 14 low, the channel began.
There have been three legs up in the channel, but the daily chart has been sideways for two weeks. In addition, there is no clear top for the third leg up.
Finally, there are magnets above. The 50% retracement is at $60.77. A Leg 1 = Leg 2 measured move projection around $62. Leg 1 ended at the Jan. 11 top of the Spike and Leg 2 began with the low of the Jan. 14 pullback. That is the start of the bull channel.
In addition, $60 is a big round number and a psychological magnet. And, the Jan. 28 and Feb. 11 double bottom bull flag has a measured move target in that area as well.
Testing resistance
The rally is close enough to the targets for traders to conclude that the resistance has been tested. That means a reversal down can begin at any time.
However, it is more likely that significant profit-taking will not begin until the rally goes above at least a couple of the targets. Traders should expect slightly higher prices within a couple of weeks and then a pullback to support. The nearest support is the March 8 higher low of $54.82.
Bull channel is a bear flag
A bull channel has only a 25% chance of a successful breakout above the top of the channel. If the daily chart accelerates up within the next few weeks, there is a 75% chance that the breakout above the channel will reverse down within five bars.
Because a bull channel typically has a bear breakout, traders should think of a bull channel as a bear flag. The first goal is a test of the bull trend line at the bottom of the channel. The selloff usually falls below that and tests lower highs in the channel.
The bull channel in a Spike and Channel bull trend typically evolves into a trading range. The bottom of the range is usually around the start of the channel. That is the Jan. 14 low of $51.31. Since the rally from that low has lasted two months, a selloff back down will probably take at least a month. A minimum goal for the bears is a test of the March 8 higher low just below $55.
Trading Room
Traders can see the end of the day bar-by-bar price action report by signing up for free at BrooksPriceAction.com. I talk about the detailed E-mini price action real-time throughout the day in the BrooksPriceAction.com trading room. We offer a two-day free trial.


