

Al Brooks provides his weekly technical outlook on the euro FX and crude oil.
The EURUSD weekly Forex chart has sold off from the June high in a weak bear channel (see chart below). It now has been in a tight trading range for five months. Every leg up and down has reversed within two to three weeks. This is the longest time in a trading range in more than two years. As a result, traders expect a breakout soon.
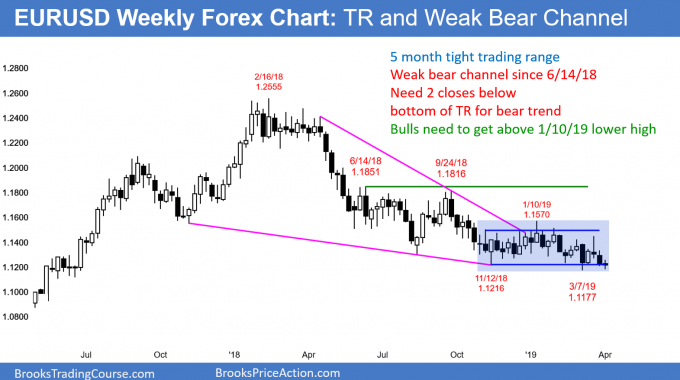
Obviously, the market is expecting Brexit to be the catalyst that leads to the breakout. However, it is a mistake to assume that either the bulls or bears currently have an advantage. The market could not be going sideways if it was more likely to go up or more likely to go down. It is going sideways because the bulls and bears are equally strong. They have been alternating control every few weeks.
Because the daily chart is now at the bottom of the trading range, the odds favor sideways to up over the next week. But news from Brexit can convert the five-month trading range into a bull or bear trend in an instant.
Trading range means Breakout Mode
The chart is in Breakout Mode. When that is the case, there is a 50% chance that the first breakout will fail. Furthermore, there is a 50% chance that once there is a successful breakout, it will be up, and a 50% chance it will be down.
There are several choices for the top and bottom of the range. This matters because traders expect a measured move up or down once there is a breakout. The four-month range is about 350 pips tall. Therefore, the measured move targets are around 1.08 for the bears and about 1.19 for the bulls.
It is important to remember that there is no breakout until there is a clear breakout. In the meantime, it is better to bet on reversals.
Crude Oil Bulls are Cruising
Crude oil futures are in the midst of a three-month rally. The rally has been especially strong since early March. There are now five consecutive bull trend bars on the weekly candlestick chart (below).
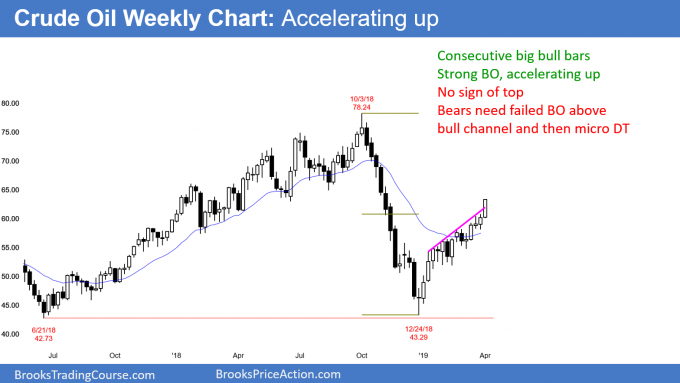
This week’s candlestick was a big bull trend bar that closed on its high. It followed a good buy signal bar last week. This is a new breakout. There will be trapped shorts who will be desperate to buy the first small pullback. Consequently, the odds favor at least a small second leg up after the first one- to two-week pullback.
While a strong breakout is unsustainable and climactic, there is no top yet. Higher prices are likely. Buy climaxes eventually entice bulls to take profits. Once the profit-taking begins, there will probably be a pullback lasting one to two months.
When a bull channel is tight, it usually has to transition into a trading range before it can reverse into a bear trend. Therefore, the weekly chart will probably have to move sideways for several weeks before the bears can create a significant swing down.


