

Despite global easy money policy, gold appears to have made a major technical top, is $1,200 next, asks Matt Weller.
As any gold bug will tell you, last year’s fourth quarter was a strong one, with the yellow metal gaining nearly 8% from October through New Year’s Day. The good times carried over into mid-February, when gold peaked near $1,350, but the price action over the last two months suggests that a major top may have formed.
As the chart below shows, the first quarter’s price action formed a large “rounded top” (or a modified head-and-shoulders pattern). This pattern was preceded by a triple bearish divergence in both the relative strength index (RSI) and MACD indicators, a clear sign that bullish momentum was waning through January and early February; now both indicators are in bearish territory.
With today’s 1%+ drop, the yellow metal is breaking to new year-to-date lows below the neckline of that pattern near $1,275. A confirmed breakdown would project a measured move objective just above the $1,200 level, with additional support near the October lows at $1,181.
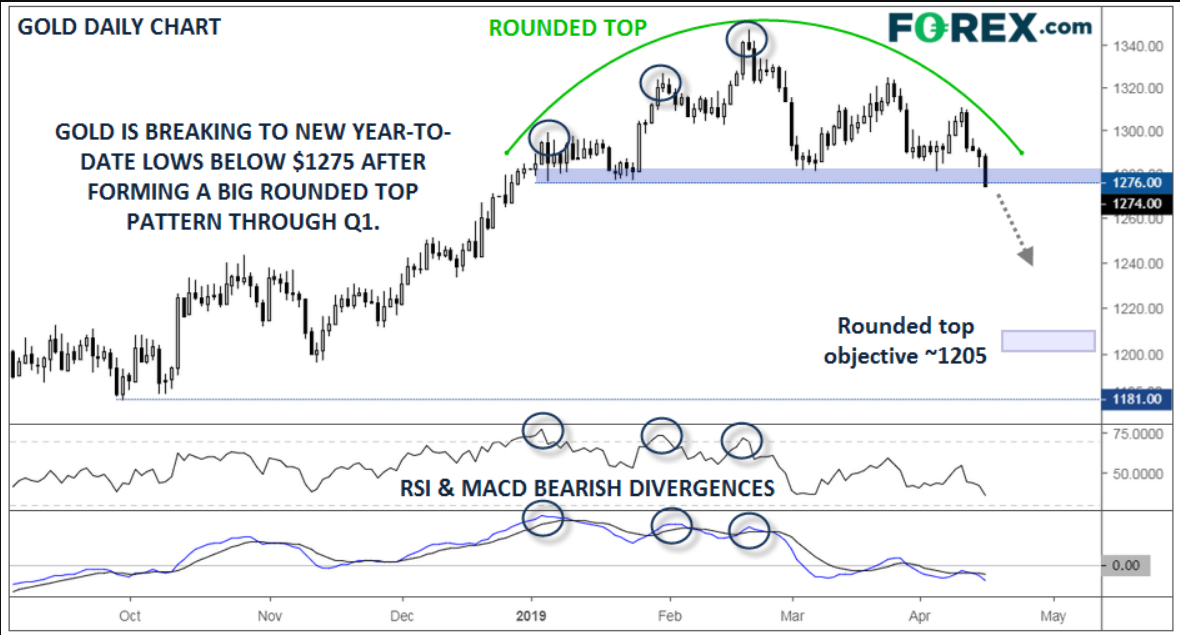
Source: TradingView, FOREX.com
From a fundamental perspective, the global shift toward easier monetary policy should act to support gold, though to the extent it’s driven by fears of an economic slowdown, it may be partially offset by decreasing demand for gold jewelry. As always, real interest rates continue to have an inverse relationship with gold, so continued signs of a slowdown in global inflationary pressures would help confirm the bearish technical picture.


