

While a correction is likely on numerous timeframes, all weakness in the S&Ps will be met by eager bulls, writes Al Brooks.
The E-mini rally has been very strong. Traders expect a new all-time high this week. Even if there is profit-taking, the first reversal down will probably only be minor.
The monthly S&P 500 E-mini futures chart has two trading days left in the month. April will probably remain as a fourth consecutive bull trend bar. The magnets above are the all-time high and the 3,000 big round number. After four strong bull bars, the bears will probably need at least a micro double top before they can get more than a one- to two-month pullback.
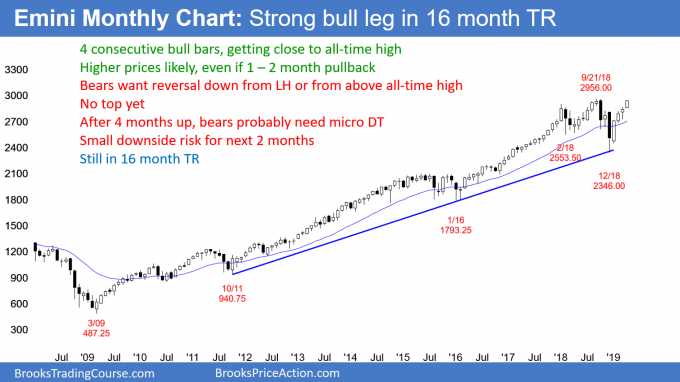
It is important to realize that the 16-month trading range might be the final bull flag. If the bulls get their breakout to a new all-time high, the bears will be ready to sell if they see aggressive profit taking by the bulls.
This is a monthly chart. Consequently, the several bars required for a reversal means the downside risk is small for the next couple months.
A reversal down from above the September high would form an expanding triangle top. The target for the bears is the bottom of the triangle, which is the December low. That is probably too far to reach in 2019. More likely, the bulls will buy and create a higher low after a 33% to 50% pullback.
The four-month rally and the 10-year bull trend are strong. Consequently, the bears will probably need at least a micro double top before they can get a reversal down. Since this would take a few months, the downside risk is small for the next couple months.
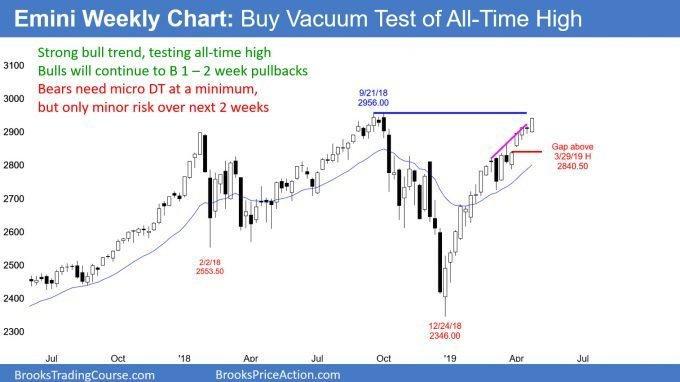
Weekly E-mini Analysis
The weekly S&P 500 E-mini futures chart had a couple reversal attempts in March. The bulls quickly bought them. With the pullbacks lasting only one bar, the best the bears can probably get over the next several weeks is a three-week pullback.
Even then, the bulls will buy it. A strong trend typically needs at least a micro double top, like the September high, before there is a swing down. Less often, there will be a blow-off top like in January 2018.
Daily E-mini Analysis
Wednesday’s FOMC announcement always can lead to a surprisingly big move that can last for several days. The bulls hope for the rally to continue to above 3,000 before there is a pullback. However, the bears want a double top with the September high.
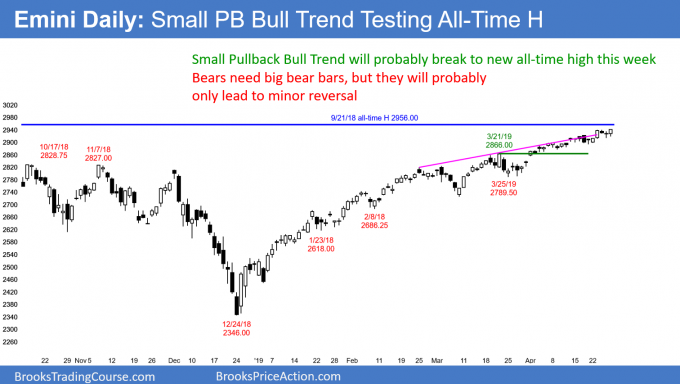
With the bull channel as tight as it is, the bulls will likely need at least a micro double top before there is a test back to 2800. In addition, when a channel is tight, the first reversal typically is minor. Consequently, the best the bears will probably get over the next few weeks is a trading range, not a bear swing.
Traders are aware of the adage, “Sell in May and go away.” There is a tendency for sideways to down trading in May and June. But, the four-month rally has been extremely strong. Even if the bears were to get a 50% correction lasting several months, there will be eager bulls looking to buy it.
Trading Room
Traders can see the end of the day bar-by-bar price action report by signing up for free at BrooksPriceAction.com. I talk about the detailed E-mini price action real-time throughout the day in the BrooksPriceAction.com trading room. We offer a two-day free trial.


