

Crude oil is range bound and searching for the bottom of the range, which could test $58, says Al Brooks.
The crude oil daily chart has probably entered a trading range. It is searching for a bottom. The legs up and down will probably last two to three weeks.
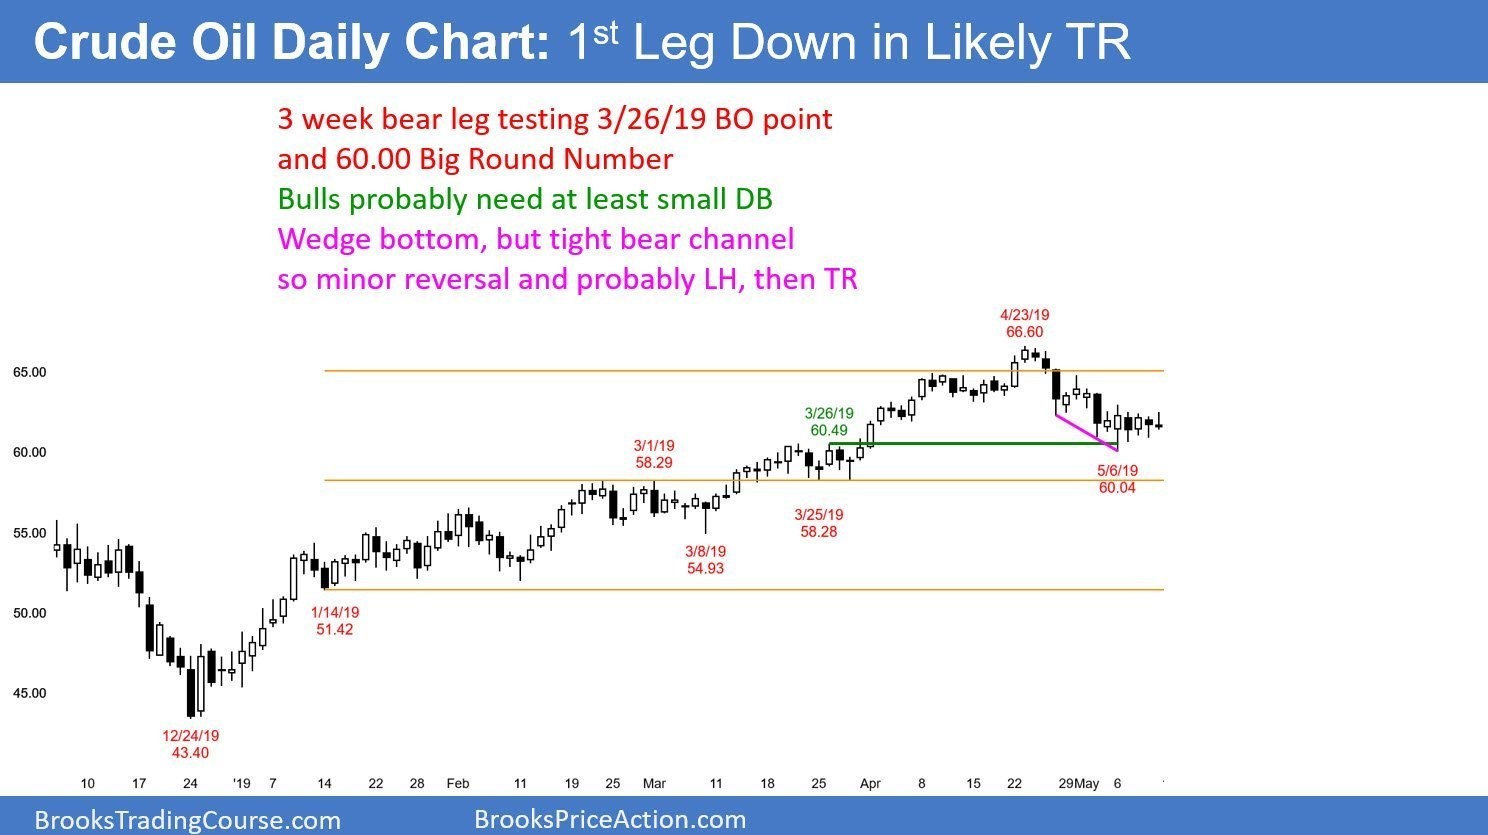
The crude oil futures market has sold off for three weeks from a buy climax at a measured move target. Nothing is coincidental, and it is amusing that the diabolical traders chose a religiously significant number ($66.60) for the top (see chart).
In mid-April, I said that the eight-day tight trading range would probably be the Final Bull Flag and that the high would be just above the measured move target. In addition, I said that there would be a pullback that had at least two legs down, and it would dip below the March 21 high. It has achieved all of those goals.
Finally, I said that the market would probably enter a trading range for a couple months. That is still the case. The market is now searching for the bottom of the range. The bulls want it to be the low of the May 6 outside up day.
However, the three-week bear channel is tight. In addition, the six-day tight range below the 20-day exponential moving average is a bear flag. Also, the absence of a clear buy signal makes it likely that the daily chart will be sideways to down for at least another week (also WTI set a new near-term low on Monday).
Second leg down likely
This three-week selloff is probably just the first of at least two legs sideways to down. If there is a rally for a week or two, traders will expect it to be only a test of the April high. They will sell the rally. That would create a lower high major trend reversal sell setup. Traders would then expect a second leg down.
However, a major sell setup only has a 40% chance of starting a bear trend. More likely, the bears would get a few weeks down to one of the higher lows in the four-month rally. The bottom will probably be below $58. Much less likely, it would be around the Jan. 14 low of $51.42.
Confusion and uncertainty create trading ranges
After a reversal down from a buy climax, traders become uncertain. They are confident that the market will not quickly go too high or too low. This results in them taking quick profits.
It also makes them comfortable scaling into shorts during rallies and into longs during selloffs. Buying low, selling high, and taking quick profits creates a trading range. This process is currently underway, and it will probably last at least another month.
After the extreme 2018 sell climax and the extreme 2019 rally, the trading range could last many months and possibly for the remainder of the year.


