A complete megaphone pattern in the S&P 500 suggests a major breakout is on the way. The only question is in which direction, notes Suri Duddella, who will be presenting at the MoneyShow Seattle on June 16.
After steep declines during subprime mortgage crisis and the U.S. recession (2007-2009), the S&P 500 Index (SPX) made an ominous low of 666 in March 2009 and started a bull rally to a high of 2872 in January 2018. Since January 2018, SPX has been trading in the broad range between 2346 and 2954 and making higher-high peaks and lower-low troughs forming a Megaphone pattern.
Megaphone patterns are considered both reversal and continuous patterns and usually, appear at the significant tops and market bottoms. This pattern may also be called as “Inverted Symmetric Triangle" pattern or “Broadening” pattern and usually, develops after a strong up or down trend in the underlying price.
Megaphone pattern formations have five distinct swings. Each swing is larger than the previous swing, which gives the formation its Megaphone appearance. The key swing points in the Megaphone pattern are structured with lower low troughs and higher high peaks and are connected by two diverging trendlines. Each of these swings may also include small minor swings. The key swings of the pattern are the first and the fifth swings, which show the reversal of major direction prior to the formation of the pattern. Another unique characteristic of Megaphone top/bottom patterns is that each swing’s increasing volatility triggers the reversals of upside and downside swings.
Megaphone patterns present two trading opportunities:
1. Trading the breakout as a Megaphone continuous pattern.
2. Trading the reversal as a Megaphone reversal pattern. Trades are placed after price reverses from the 5th swing pivot level.
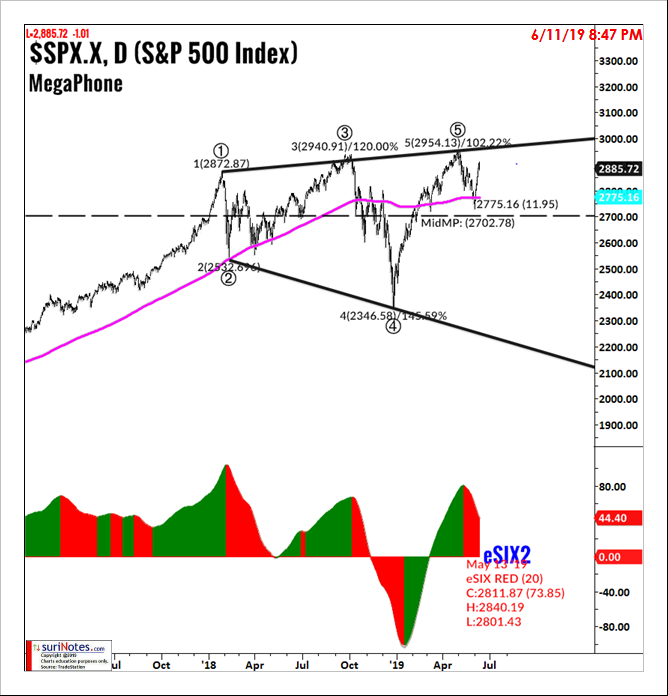
The following SPX daily chart (below) shows a Megaphone pattern formation with three top peaks (2872, 2940, and 2954) and two bottom troughs (2532, 2346). During May 2019, SPX retraced 37% of its prior swing (2346 to 2954) to trade near the 200-day simple moving average (2775). SPX has made a critical 5th pivot at 2954. This pivot level could be a breakout level if SPX continues to trade above 2954. The underlying trend has been bearish since May 13. A breakout above 2954 needs confirmation to be bullish. If SPX reverses its June rally and trades below the mid Megaphone level (2702), SPX may see a steep decline.