

Euro bulls were disappointed by the strong reversal down last week, notes Al Brooks.
The EURUSD currency chart is still on a consecutive outside bar buy signal. Even though it sold off last week, traders should expect at least a small second leg up beginning within two weeks.
The weekly chart has been in a tight bear channel for a year. Every move up and down reversed within a few weeks. However, two weeks ago was the first time since September that the bulls got a close above the 20-week exponential moving average. They also got a close above the bear trend line (see chart below). But traders want to see consecutive closes above resistance before they believe a breakout will succeed.
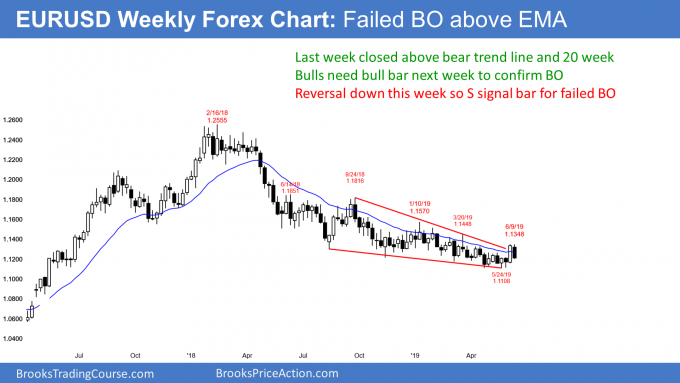
The bulls were disappointed by the strong reversal down last week. They wanted a second big bull trend bar closing on its high. The probability now favors a failed breakout and a test of the May low.
The bulls, however, still have hope. Wednesday’s FOMC report has the potential to create big moves in all financial markets. If the bulls are lucky, they will get a surprisingly big rally after Wednesday’s report. Sometimes follow-through buying after a breakout comes a week or two later. They are hoping that will be the case this time.
Weak sell signal on the weekly chart
Since last week was a bear bar closing near its low, it is a sell signal bar for this week. The bears see the three-week rally as just another bear rally in the yearlong bear channel. This past week’s bear body represents a failed breakout and the start of a reversal back down to below the May low.
The bears need a strong entry bar this week. If instead the euro reverses back up, then the probability will again shift in favor of a successful breakout above the bear channel.
The EURUSD daily chart formed a consecutive outside bar buy signal two weeks ago. I have been saying for the past week that there might be a test back down to the June 6 low. That is about a 50% pullback and a test of the April 2 higher low as well.
Friday’s selloff could be that test. However, after three bear days, the bulls need to stop the selling. They then need a reversal back up from a higher low. If they get their reversal within the next two weeks, there will be a head and shoulders bottom on the daily chart. The left shoulder is the April 2 higher low and the head is the April 26/May 23 double bottom.
The bears are hoping that the three-day selloff is a resumption of the yearlong bear trend. However, they need a close below the May low. Without that, the bulls will buy and try to create a higher low major trend reversal up (here, also a head and shoulders bottom).
Traders expect all financial markets to be in limbo ahead of Wednesday’s FOMC announcement. The uncertainty is greater than usual, which increases the chance of a big move up or down after the report.
Trading Room
Traders can see the end of the day bar-by-bar price action report by signing up for free at BrooksPriceAction.com. I talk about the detailed E-mini price action real-time throughout the day in the BrooksPriceAction.com trading room. We offer a two-day free trial.


