The exchange traded fund tracking IPOs has completed an V-bottom and is set to breakout, points out Suri Duddella.
The year 2019 appears to be the year of Initial Public Offerings (IPOs) capitalizing on millennial trends. Millennials started to invest in the companies that are familiar to their lifestyles, like ride-sharing companies Uber Technologies Inc. (UBER) and Lyft Inc. (LYFT), or meat substitute company Beyond Meat Inc. (BYND). Millennials are mostly geared towards technology IPOs which are making basic tasks easier using technology. Some of these IPO examples are Uber, Lyft, Pinterest Inc. (PINS), Zoom Video Communications Inc. (ZM), Fiverr International Ltd (FVRR) and Crowdstrike Holdings Inc. (CRWD). Additions tech companies to go public this year are Airbnb and Robinhood.
Many of the IPOs have soared in their debut, like Beyond Meat, which went up 579% in the last two months). Retail investors may have mostly struggled to benefit from the upside as there are plenty of challenges in securing the pre-IPO shares and also the risks.
One way for the retail investors to invest in the U.S. listed IPO markets is to utilize Renaissance IPO ETF (IPO). This ETF is designed to provide investors with efficient exposure to a portfolio of newly listed U.S. public companies ahead of their inclusion in core equity portfolios. It is backed by strong research. Companies that have been public for two years are removed at the next quarterly review.
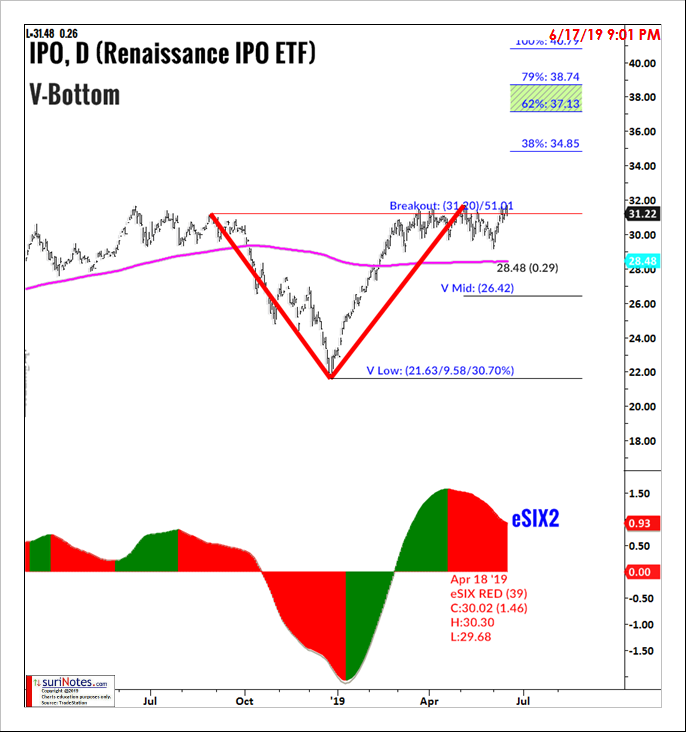
Currently, IPO is trading in a V-Bottom pattern and poised to breakout.
As the name implies, the "V" chart patterns have the letter "V" shape and prices shift momentum from an aggressive sell-off to an aggressive rally in its structure, leaving a V chart pattern. It is relatively a rare pattern with extreme angles and maybe not easy to recognize until it is mostly formed. The V-Pattern is a powerful reversal pattern seen in all markets, all time-frames and in all instruments. The "V" pattern consists of rapid price action and may not be suited for all casual investors. It is also not suited to attempt to predict. Once identified, and the underlying market completes the formation a breakout may be signaled.
The chart below shows IPO's daily near-complete V-Bottom pattern forming from July 2018 to June 2019. Currently the breakout level is set at $31.20. If price breaks above that support the V-pattern targets are set at $37-39.
Find more of Suri’s work at surinotes.com