

While the S&P 500 hit all-time highs last week, there are signs bulls should be nervous, writes Kerry Given.
The S&P 500 Index (SPX) traded steadily higher last week, closing Friday at 3014, up 1.1% for the week. Friday’s trading was a little subdued in the morning but rallied late in the day to push to a new all-time high at 3014. But before we bank on those new all-time highs, our enthusiasm should be tempered by the relatively low volume.
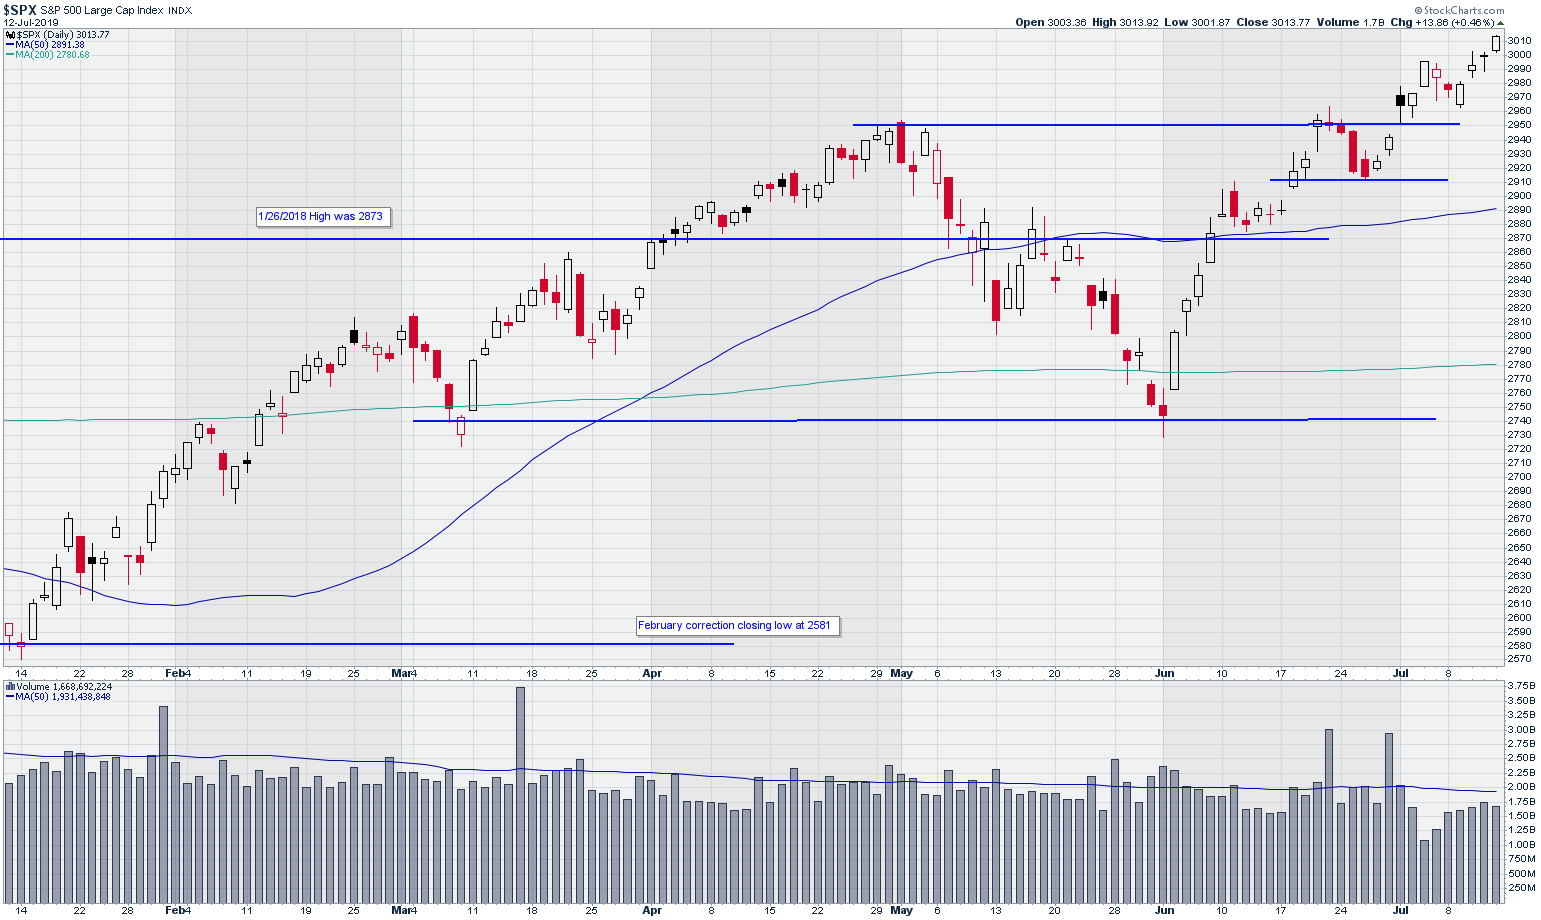
Standard and Poor’s 500 Index (SPX)
Chart courtesy of StockCharts.com
Trading volume in the S&P 500 started July almost precisely at the 50-day moving average of 2 billion shares. But that was the high for the month thus far. The low trading volume after the Fourth of July was to be expected, but trading volume continued to meander along at low levels last week. This isn’t the sign of a confident bull market.
The S&P 500 index has now traded in the upper quartile of the Bollinger bands for most of June and all of July to date (see chart below). We may be overdue for at least a short rest in this steady grind higher.
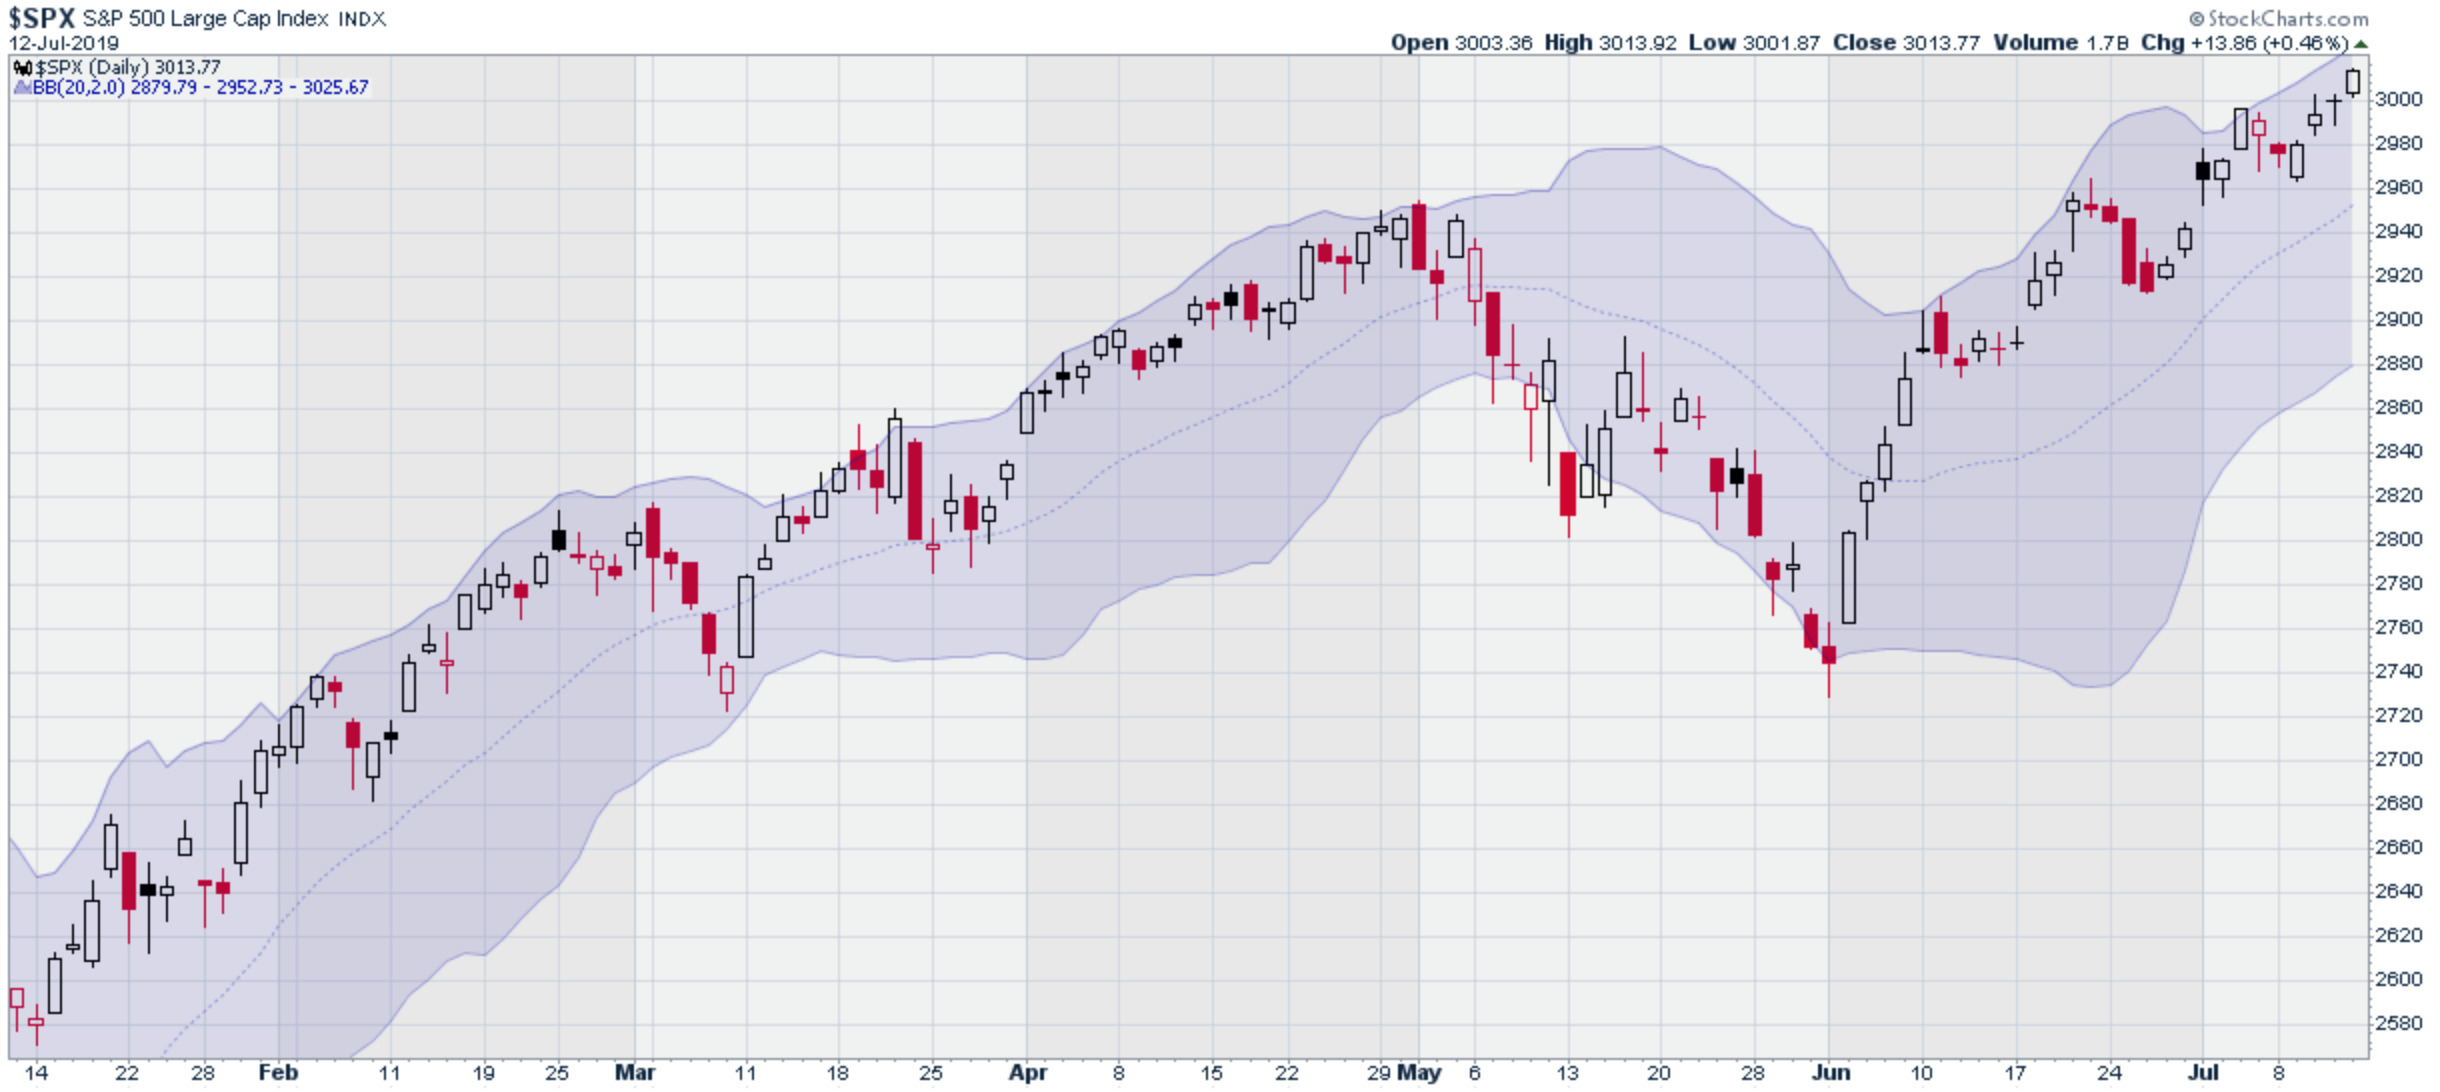
SPX with Bollinger Bands
Chart courtesy of StockCharts.com
The Cboe Volatility Index (VIX) hit an intraday high on Tuesday at 14.7%, but steadily declined the balance of the week, closing at 12.3%. VIX is often called the fear gauge so the market is not panicked by any measure. This is a bullish, but nervous, market.
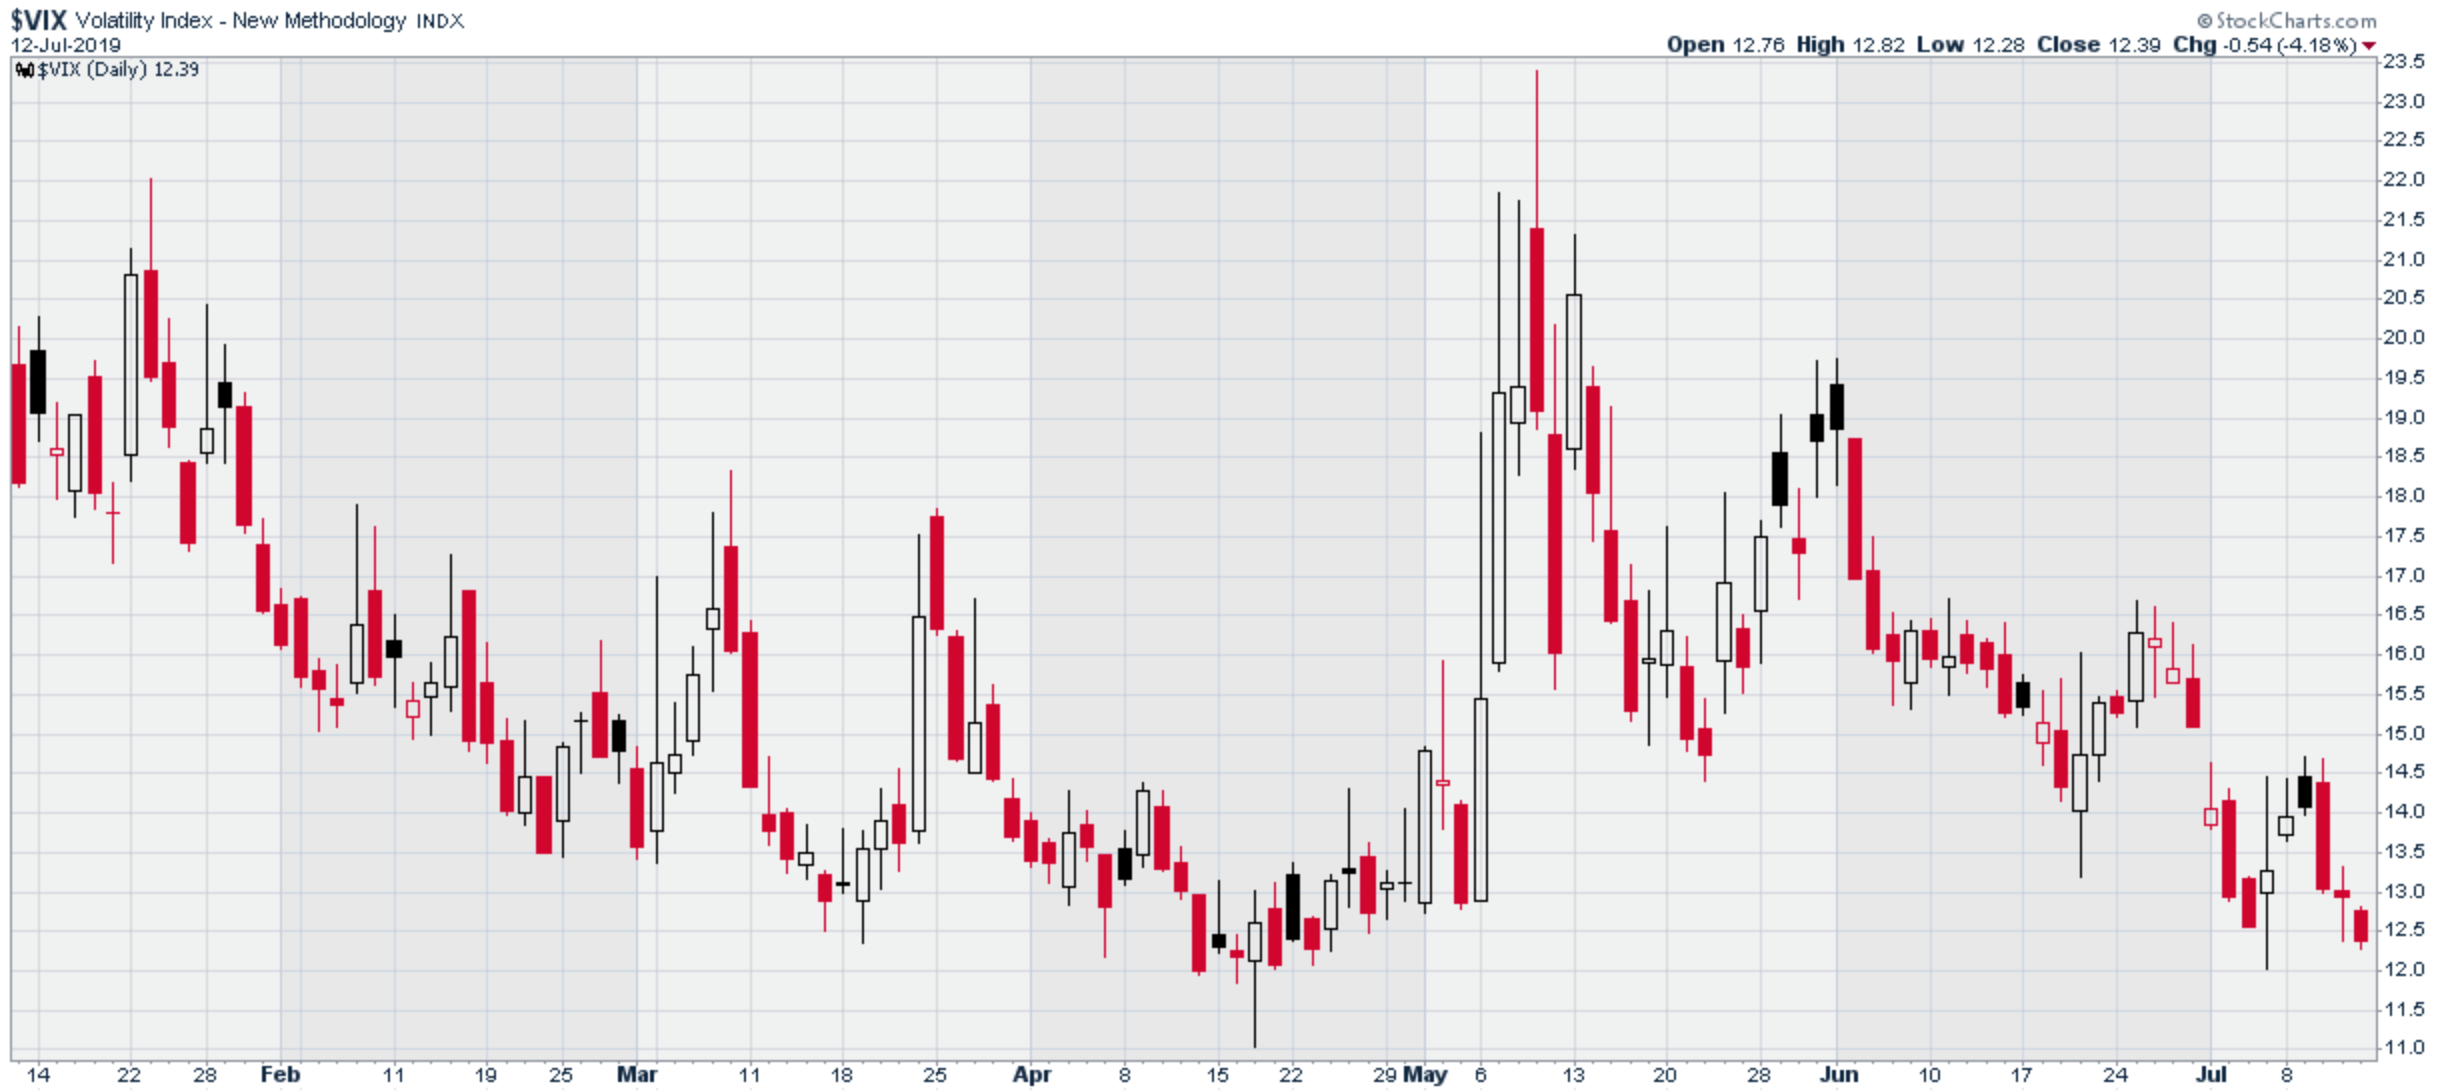
CBOE SPX Volatility Index (VIX)
Chart courtesy of StockCharts.com
Market analysts watch the small cap stocks carefully as a measure of the market’s comfort with taking on more risk. The Russell 2000 Index (RUT) is composed of small to mid-capitalization domestic companies. RUT closed the week essentially unchanged at 1570 after opening the week at 1574. Without Friday’s strong intraday move of 11 points, RUT would have posted a negative week. This stands in contrast to the steady gains of the S&P 500. Russell’s price chart is another indicator of a nervous market.
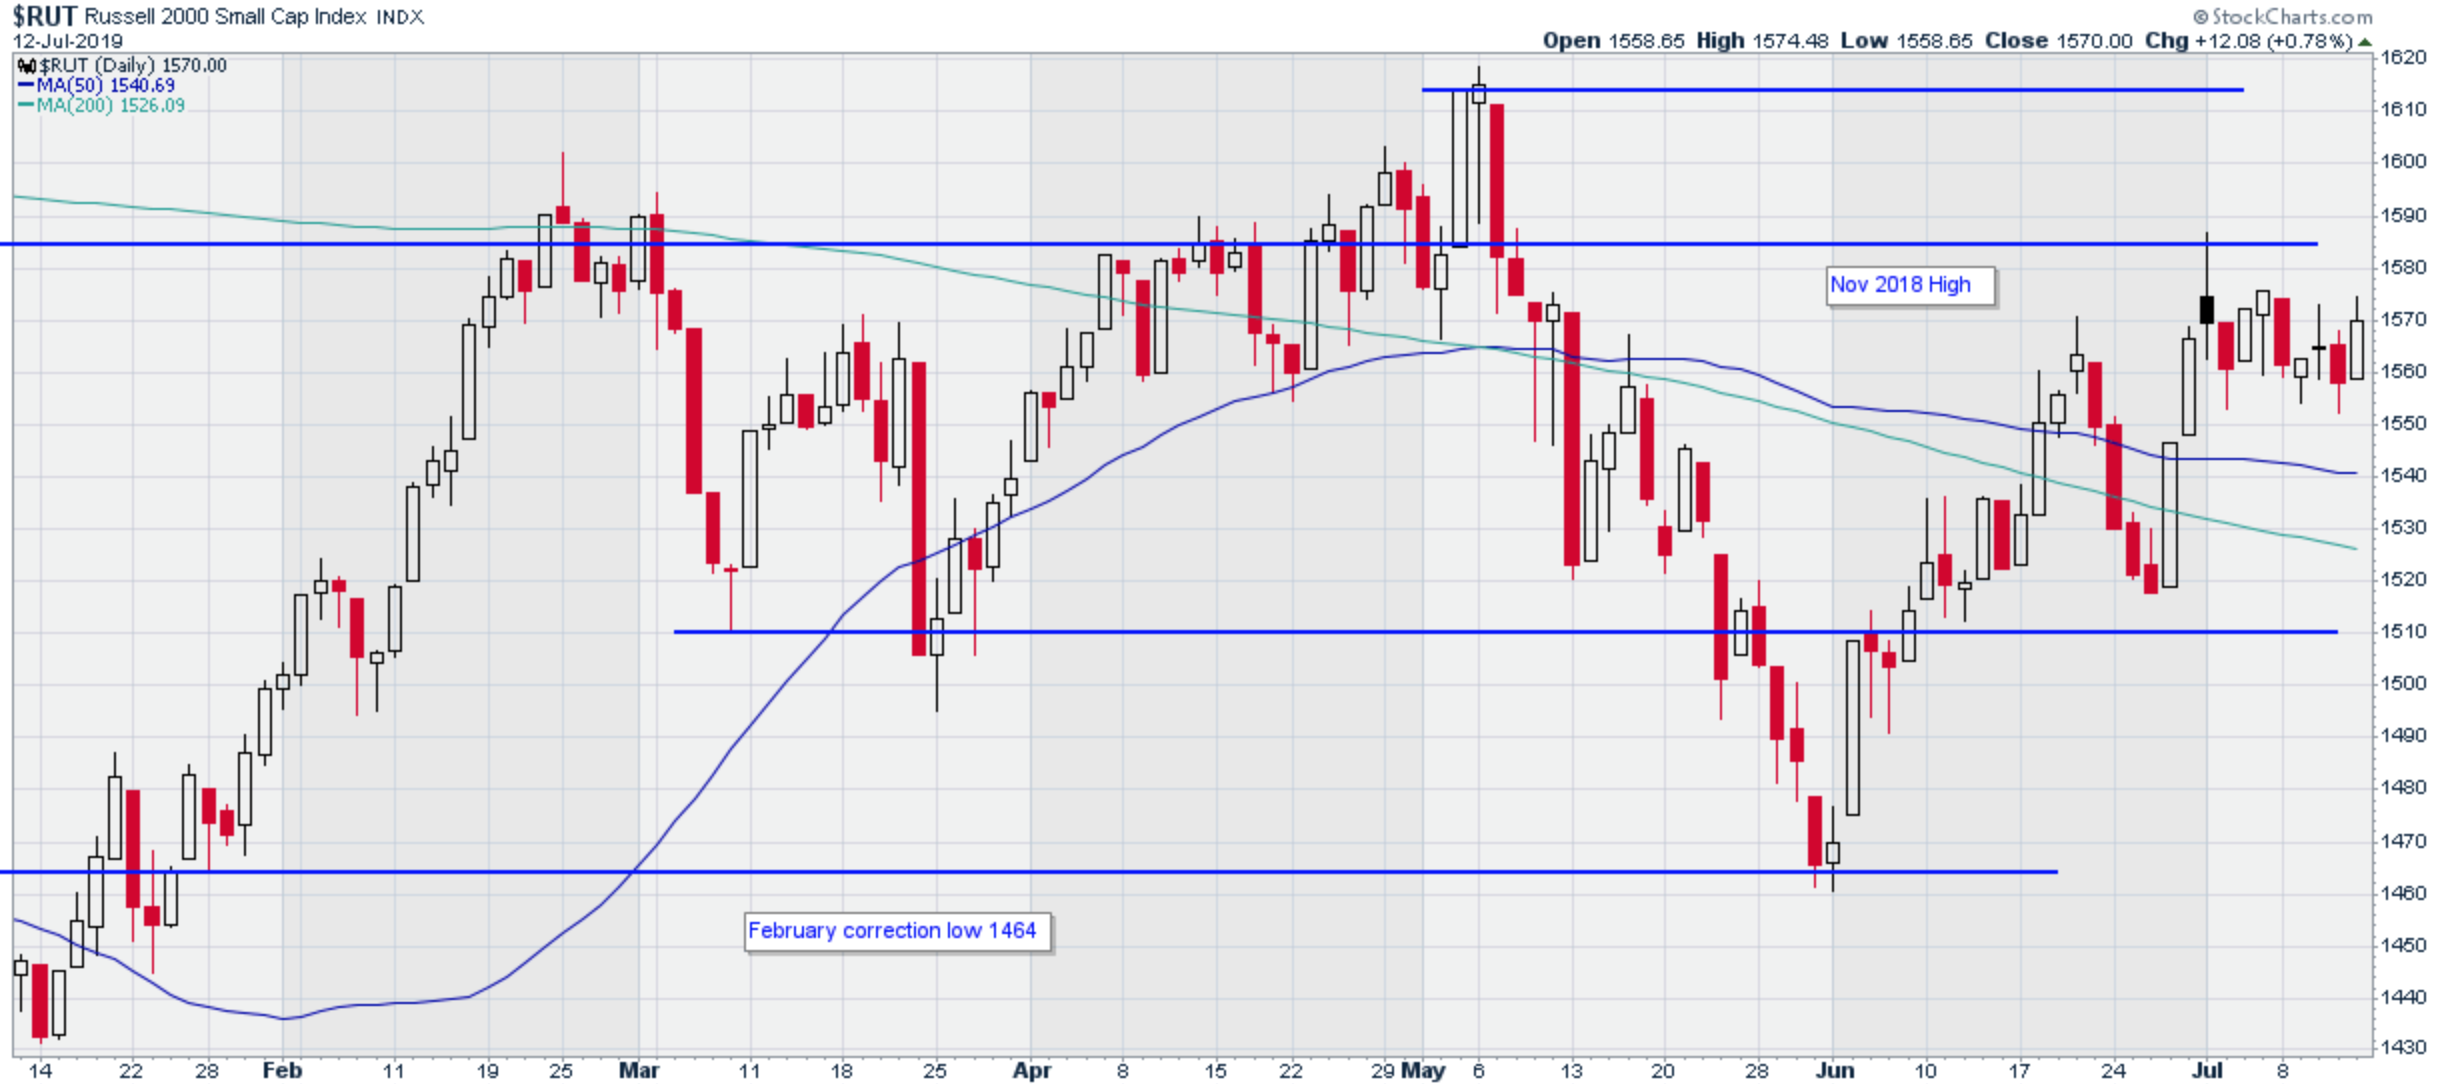
Russell 2000 Index (RUT)
Chart courtesy of StockCharts.com
The NASDAQ Composite index paralleled trading in the S&P 500 last week, setting a new all-time high on Friday at 8244. The pattern in trading volume was similar to SPX, coming in below the 50-day moving average since the first of July, and even declining the last three days of this week. NASDAQ set a new all-time high, but without much conviction (see chart).
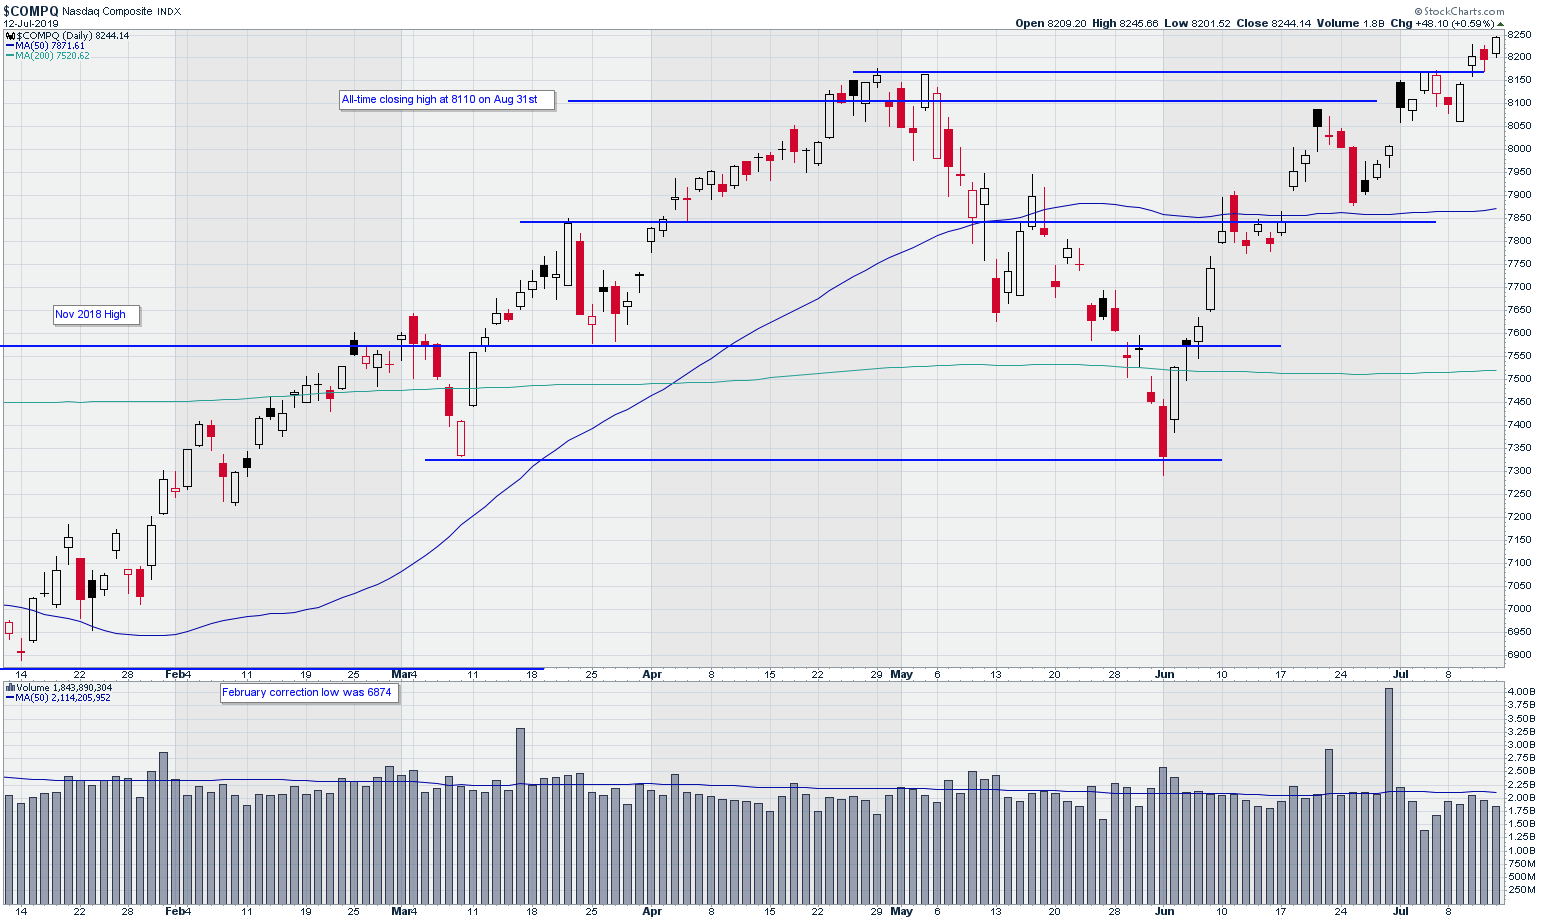
NASDAQ Composite Index
Chart courtesy of StockCharts.com
The broad market indices are being cautiously held up by reasonably positive reports concerning trade negotiations with China and expectation of a Fed Funds rate cut at the end of the month, but that could change at any moment.
The prospects of a decrease in the federal discount rate at the upcoming FOMC meeting on July 30-31 is encouraging a bullish mood for the markets, but interest rates are historically low, lowering rates is one of the most powerful tools available to the Fed. And despite the prevailing wisdom, basic economic data would have to send up some alarms before the Fed pulls that lever.
That leaves the China trade negotiations as our principal concern. Given the fact that it could rain on that parade at any moment, the nervousness of this market is not surprising. We see the signs in three principal areas: Consistently low trading volumes, modestly higher volatility and sideways trading in the small caps.
The current market gains are largely based on positive expectations for the trade negotiations with China and the prospect of lower interest rates coming out of the next FOMC meeting. That makes for a fragile basis for optimism.
Therefore, my outlook remains unchanged. Trade with expectations of a sideways to slightly bullish market, but be prepared to hit the stops earlier rather than later.
Watch the following stocks, some of which announce earnings this week, for favorable trade setups: American Express Co. (AXP) Q2 earnings on Friday July, 19, AutoZone (AZO) CME Group (CME), Copart Inc. (CPRT), Intercontinental Exchange (ICE) and Starbucks (SBUX).
All these stocks have exceptional price charts.


