

Crude oil futures have rallied for six weeks in a yearlong trading range, writes Al Brooks.
Crude oil is now in the sell zone, but there is no top yet. Crude futures rallied last week after the previous week’s selloff. The bulls are hoping that the reversal up in June is a higher low major trend reversal. More likely, the rally is a bull leg in a yearlong trading range that will last many more months.
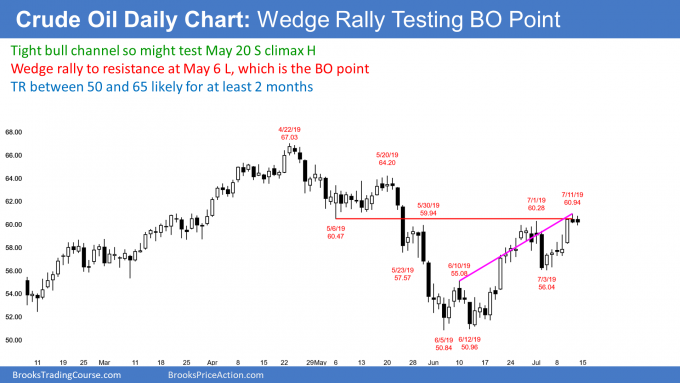
There are still magnets above and therefore the rally will probably go at least a little higher. For example, the top of the two big bear bars in May is a target. The top of any sell climax is always a magnet because many bears put protective stops just above the sell climax high. The bears are ready to give up there. Since they are thinking about giving up, there are fewer bears willing to sell once the rally gets near their stops. This lack of sellers often results in the stops getting hit. Because that was the target for the bulls, the bulls take profits and the rally often stalls at a sell climax high (see chart).
Additionally, the April lower high is resistance. Even if the bulls get a breakout above that high, there will be sellers above it. This is because traders believe that the weekly chart is in a trading range. Traders look to sell above prior highs, especially near the top of the range.
Bull leg in yearlong trading range
This six-week rally is a bull leg in a yearlong trading range. That means that there will be a bear leg. The approximate sell zone is between $60 and $70. The April 23 high is $67.03 and is a reasonable target for the rally.
The bears want to sell, but they want a bear bar closing near its low for a sell signal. They do not have that. They will also sell if they see a surprisingly big bear bar closing near its low. Until they get what they want, the odds favor at least slightly higher prices.
Is it possible that the weekly chart is now in a bull trend? The bulls have a credible higher low major trend reversal. Last year’s selloff was so strong that there is currently only a 30% chance that this rally will get up to last year’s high. It is more likely that the rally will stall within a few weeks and the chart will then go sideways to down for a month or two.
Trading Room
Traders can see the end of the day bar-by-bar price action report by signing up for free at BrooksPriceAction.com. I talk about the detailed E-mini price action real-time throughout the day in the BrooksPriceAction.com trading room. We offer a two-day free trial.


