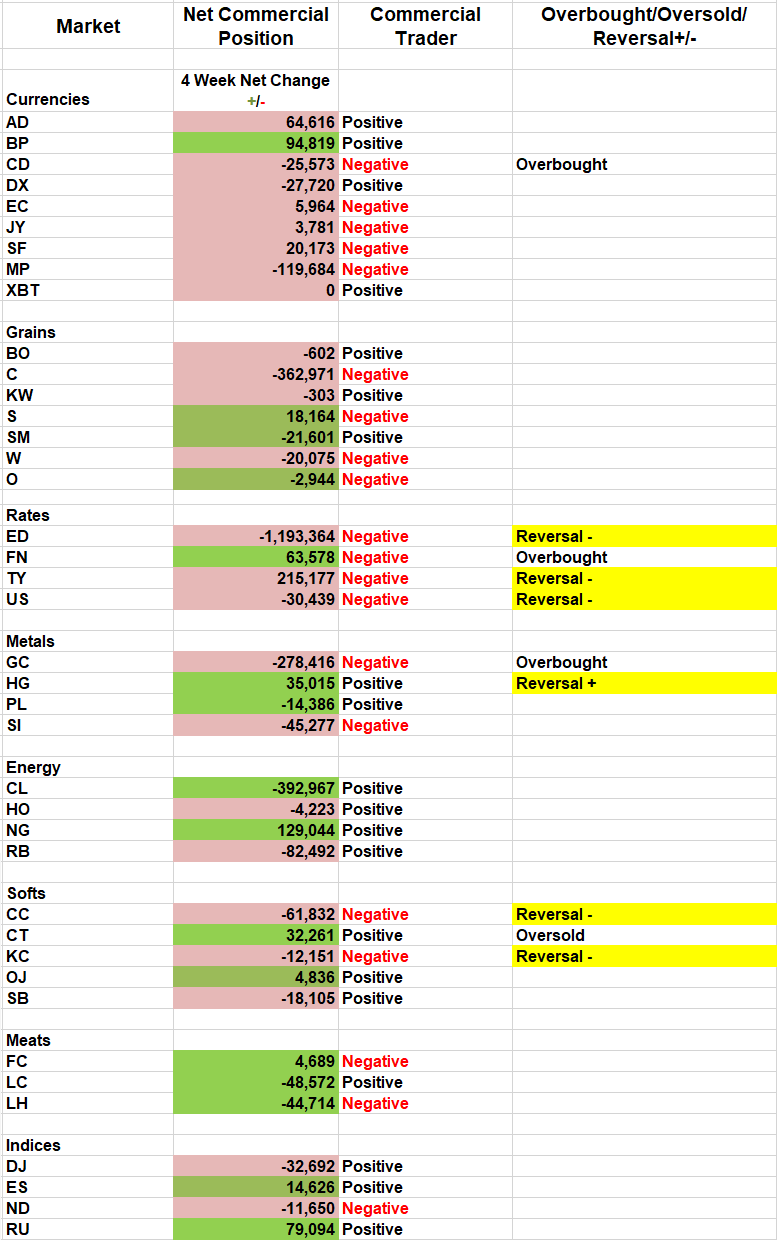
Commercial trader momentum has experienced a number of reversals across market sectors, reports Andy Waldock.
This weeks’ Commitments of Traders (COT) report features a number of reversals in commercial momentum, but none may be more significant than copper (see table).

In addition to copper and the Treasury complex, there has been reversals in cocoa and coffee.
But given the the importance of trade, copper is the most interesting.
Copper
Copper processors feel confident that the construction of all things will continue, whether this economic expansion is becoming long in the tooth or, not.
While we measure the data in the Commitments of Traders report in traditional ways, we also quantify the actions of the markets’ participants, behaviorally. Static metrics provide us with recent highs, lows, average position sizes, and plenty of other hard data points that we can compare. However, one of the most critical keys in the analysis of the COT report is the pace of the participants’ actions.
We want to know how excited the commercial traders are to transact business at a given price level. We’ll explain the process of measuring the last week’s moves in the COT report to the average net change of a given trading group’s actions in detail at the TradersEXPO Chicago on July 23.
The copper market is currently exhibiting the commercial trader behavior for which we are looking. Commercial traders in the copper market are anxious to lock in the raw material supplies at $2.60 per pound. The December 2018 contract made its low on Aug. 16, at $2.5745. The March 2019 contract made a low at $2.5430, this January. Finally, the current September contract made a significant low on June 7 at $2.5995.
Most importantly, the net commercial position has increased in each of these declines. This pattern shows that the commercial traders are buying copper at higher prices. In fact, the commercial trader position reached higher a net long total on each successive decline.
The commercial buying spree show up on our screens as weeks where the commercial position has increased by more than two standard deviations compared to their average purchases. This shows that the copper processors are anxious to get their raw materials purchased at these prices.
These situations don’t occur very frequently. Aside from this past January, and mid-September of last year, we have one episode in 2015 on the buy-side and have to go back to June of 2012 to find their next buying surge. That gives us four windows in the last seven years when copper processors were this anxious to shore up their supplies.
Their information is better than ours. Whether their current buying is enough to start an upward trend or, reverse the recent decline, we feel that this low is a buying opportunity.
Cocoa
The cocoa market’s rally is currently experiencing its most intense producer selling since the July 2018 cocoa futures peak on April 26 at $2,943 per ton. Commercial cocoa producers are acting quickly to lock in delivery prices at $2,500 per ton. Their previous selling pressure situations include November 2017 all the way back to October of 2013.
It’s also important to note that the cocoa producers’ net position now equals their net short position from the April high just mentioned. This means that cocoa producers are now willing to sell an equal amount of cocoa now, at prices at least 17% cheaper.
It’s possible that commercial traders are also afraid of losing the current bid due to the September cocoa contract’s seasonal peak in mid-July.
We’ll short the September cocoa and look for prices to retreat over the next three to four weeks.
Find out exactly how we put these charts together including the TradeStation code to include these filters in the development of your own algorithms at TradersEXPO Chicago on July 23. I'll also present seasonal TradeStation code that will allow you to convert calendar dates into trading windows of opportunity quickly.


