

Crude oil futures are in a yearlong trading range, reports Al Brooks
They sold off sharply last week from the sell zone above $60. They are now in the buy zone at around $55 but will need a micro double bottom before another test of $60.
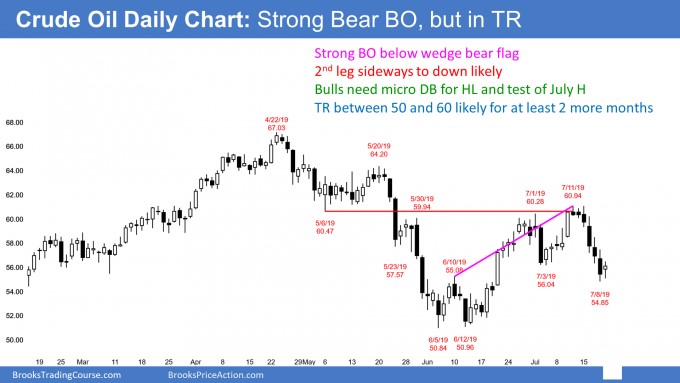
Crude oil futures sold off strongly last week despite so many analysts talking about a bull trend. The rally was a bull leg in a yearlong trading range. Furthermore, it was in the sell zone above $60.
This week’s selloff was surprisingly strong. When there is a Bear surprise there is usually at least a small second leg sideways to down. Consequently, traders will sell the first one to three-day rally to test the 20-day exponential moving average, which would be about a 50% pullback.
It is now in the buy zone around 455 formed by the July 3 low and the June 10 high. The bulls will probably need at least a micro double bottom before traders will look for the next leg up. Crude oil is now forming a smaller range between 450 and $60 within the yearlong trading range between $43 and $79. Keep looking for reversals.
Bet on reversals
It is important to understand what is meant by the chart has been in a trading range and it will probably continue all year. Trading ranges have legs up and down. They often become stronger after five to 10 bars. They trap traders into buying high and selling low.
It is natural to hope for a trend. However, markets have inertia. They have a strong tendency to continue to do what they have been doing. Since the crude oil market has been in a trading range, buying strong rallies and hoping for a bull trend, or selling strong selloffs and expecting a bear trend is the wrong approach. It is better to buy low and sell high.
Additionally, a trader will make more money taking profits when there is a strong move in his direction. Bulls should exit on strong rallies and bears should take profits on strong selloffs.
The probability favors reversals. Obviously, there will be a trend at some point. A trader will make more money trading it like the trading range that it is instead of trading like the trend that it is not.
Trading Room
Traders can see the end of the day bar-by-bar price action report by signing up for free at BrooksPriceAction.com. I talk about the detailed E-mini price action real-time throughout the day in the BrooksPriceAction.com trading room. We offer a two-day free trial.


