

Bitcoin is looking to breakout, and probably to the downside. Why 10k seems like a nice big level, look for a test of the June low, writes Al Brooks.
Bitcoin has been in a triangle pattern for a couple months, which is Breakout Mode. But there are slightly better odds for a break below the $10,000 support and test the bottom of the June rally at $7,442.
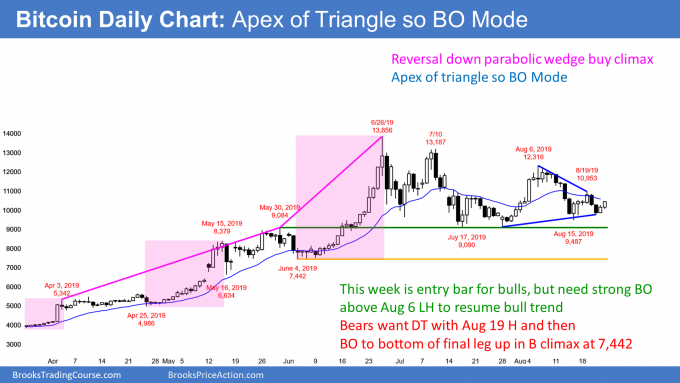
Bitcoin had a huge rally for the first half of 2019 and has been trading sideways for three months. There is a consecutive bullish inside bars (ii) set-up on the monthly chart (not shown). The bulls and most of the TV pundits see the trading range as a bull flag. They want a breakout above the August high and then a test of last year’s all-time high.
But there are problems with this setup. The rally had three pushes higher, with each leg getting significantly bigger. This is a parabolic wedge buy climax. The bulls were exhausted and took profits in July. It is a mistake to assume they will be quick to buy again.
A reversal from a buy climax typically lasts longer and falls further than what seems reasonable to most traders. The strong bulls will only buy once they are convinced that there is no one left to sell. At the moment, there are many traders ready to sell. Who are they? They are the emotional bulls who have been buying the pullback for the past two months, afraid that the bull trend will soon resume without them.
$10,000 is probably fake support
Bitcoin broke strongly above $10,000 in June. It is a Big Round Number and traders are hoping it will be support. But there is a problem. Traders have been easily able to buy pullbacks to below $10,000 for over a month. Traders should realize that a good fill is usually a bad trade.
All markets are mostly made up of institutions. If you take any trade, you should assume that an institution is taking the opposite side.
Furthermore, it is useful to assume that we are dumb, and they are smart. If it is very easy to do something, then an institution is eager to do the opposite.
Traders have found it easy to buy at $10,000. That means many institutions are eager to sell there. Why? Because they think Bitcoin will go lower and they can make money.
Unless the bulls get a strong reversal up from $10,000 within the next few weeks, Bitcoin will probably break below there. All of those bulls who thought it was support, will sell out of their longs in a panic. The result will be a quick move down to the next support, which is $7,442.
What happens if the weak bulls exit?
If the rally continues to fail to materialize, at some point the weak bulls will begin to think that they bought too early and too high. If they come to that conclusion, they will exit their longs in a panic. That would result in a break below the three-month trading range.
When there is a reversal down from a parabolic wedge buy climax, the selloff usually retraces to the bottom of the final leg up. That is the June 4 low of $7,442, and it is a reasonable target. Less likely, the selloff will continue down to the bottom of the pullback after the first leg up. That is the April 4 low of $4,784.
But if Bitcoin truly is in a bull trend, the two-week rally will be the start of a series of many bull bars on the daily chart, like in early June.
Show me the money. I think lower first, then higher.
Trading Room
Traders can see the end of the day bar-by-bar price action report by signing up for free at BrooksPriceAction.com. I talk about the detailed E-mini price action real-time throughout the day in the BrooksPriceAction.com trading room. We offer a two-day free trial.


