

While zero U.S. interest rates are unlikely, the bond rally will have one more leg up before its long-expected reversal, writes Al Brooks.
The 30-year U.S. Treasury bond futures have a weak breakout above the 2016 wedge top. The odds favor a month or two of sideways trading.
The 30-year U.S. Treasury bond futures has been in a strong bull trend over the past year. The August rally broke slightly above the 2016 wedge top and all-time high (see chart).
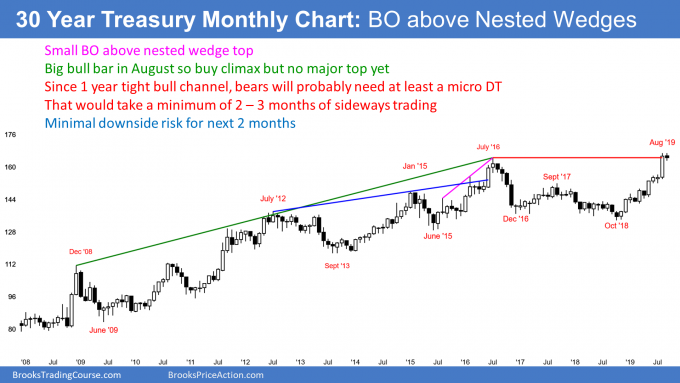
In general, when there is a breakout above a wedge top, there is a 50% chance of a measured move up and a 50% chance of a reversal down. But a nested wedge top is a reliable pattern. Therefore, there is only a 40% chance of a strong break above the 2016 high, and a much smaller chance of a measured move up. Traders should expect a reversal down within the next five months.
Most tops are not abrupt. There will typically be at least a micro double top, like in January 2015, or three consecutive bear bars, like after the July 2016 high. That means there is not much downside risk for several months.
Zero interest rates are unlikely
Several market analysts expect U.S. interest rates will fall to zero, like it has in so many other wealthy countries. While statements like this get a purported expert some time on TV, his lemming logic is foolish. Lots of things sound good on TV, but if you take a minute to think about them, there is often no logical basis for the statement.
I am not saying that a negative interest rate is impossible for U.S. Treasuries, but there is no rational basis for that conclusion. In fact, the monthly 30-year Treasury bond tells a different story.
Breakout above 9-year wedge top
For more than five years, I have been saying that the monthly chart rally would continue up to form to a nested wedge top. I carefully chose my words. I repeatedly said that the high would be the final high or near the final high for the next 20 years.
That is still the case. The 2019 rally broke above the 2016 top of the 2008 to 2016 wedge in August. This breakout might continue up for another 10% and last for a year or more. But the odds are that the breakout will ultimately fail. A reversal down would be a failed breakout above a wedge, and the implication is the same as for a wedge top.
The wedge rally began with the December 2008 high and has now lasted 11 years. Once there is a reversal, the bear trend will last at least 10 years and probably 20 years. That means interest rates will soon begin to trend higher for a long time.
But as climactic as the August bar was, there is no top yet. Even if September ends up as the final high, the chart will likely have to go sideways for several bars (months) before there is at least a micro double top. That is the minimum traders want to see before they will bet on a reversal down. Even though September is typically not good for bonds, there is not much downside risk for the next couple months.
Trading Room
Traders can see the end of the day bar-by-bar price action report by signing up for free at BrooksPriceAction.com. I talk about the detailed E-mini price action real-time throughout the day in the BrooksPriceAction.com trading room. We offer a two-day free trial.


