

While the euro currency appeared to reverse higher last week, the signal is not strong on the rally will not last, writes Al Brooks.
The EURUSD reversed up from the bottom of a 22-month bear channel last week on its weekly chart. However, there is also a 12-week bear channel and it is tight. This makes only a minor reversal up likely.
The weekly chart in the EURUSD currency pair formed a bull reversal bar last week (see chart). The low poked below the bottom of the bear channel that began 22 months ago in November 2017. It was also a reversal up from the bear channel that began on June 25.
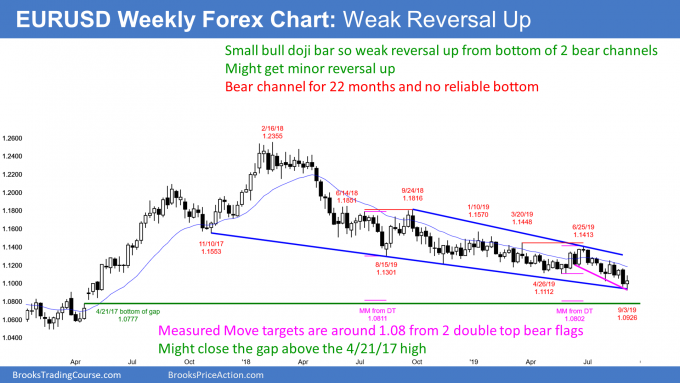
While last week’s candlestick had a bull body, it was small. A doji bar like this is a weak buy signal. This is especially true in a tight bear channel, like the one down from the June 25 high. A rally from a weak setup typically is minor. That means that a bear flag or a bull leg in the bear channel is more likely than a bull trend.
For the past year in the bear channel, every strong rally reversed down from a lower high after a few weeks. In addition, every strong selloff reversed up within a week or two of making a new low.
Price action does not remain constant forever. A year in a tight bear channel is unusual. Consequently, traders expect change soon.
A bear channel is a bull flag
A bear channel behaves like a bull flag 75% of the time. Traders expect a break above the channel and the end of the bear trend. When a bear trend ends, there is usually then a trading range that can last many bars. Less often, a bear trend immediately reverses into a bull trend.
In 25% of bear channels, there is a successful bear breakout below the bear channel and an acceleration down. In 75% of cases when there is a break below the bear channel, the selloff reverses up within five bars. When it does, the rally then usually breaks above the bear channel and the channel transitions into a trading range or bull trend.
There is currently no evidence of a breakout above or below the bear channel. As a result, traders will continue to look for reversals every few weeks.
It is important to note that there are magnets below. Two bear flags have measured move projections to just above 1.08. Also, the bottom of the April 2, 2017 gap is just below 1.08. Most gaps get filled, especially if the market gets close. Many traders will not trust a reversal up until after these targets have been reached.
Trading Room
Traders can see the end of the day bar-by-bar price action report by signing up for free at BrooksPriceAction.com. I talk about the detailed E-mini price action real-time throughout the day in the BrooksPriceAction.com trading room. We offer a two-day free trial.


