

The 30-year U.S. Treasury bond futures has a parabolic wedge top on its weekly chart, notes Al Brooks.
The Parabolic wedge top on the long bond is also a Low 4 Top. It will trade sideways to down for many weeks.
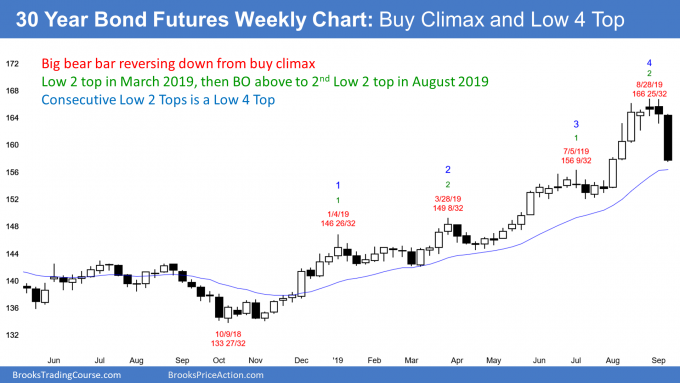
The 30-year Treasury bond futures market has rallied strongly since October 2018. The rally has been in a tight bull channel and the slope has been increasing. The four legs up on the weekly chart mean that the rally is a parabolic wedge buy climax (see chart). That is any rally with three or more legs in a tight bull channel.
It is important to note that the weekly chart is reversing down from just above the July 11, 2016 high. This is therefore a slightly higher high double top in addition to the 2019 buy climax.
When there is a double top, the second leg up is often a wedge, like the case here. This increases the chance of a successful reversal down.
Breakout above 2008 – 2016 nested wedge top
The July 2016 rally ended with a huge nested wedge top (not shown) where the first leg up was in December 2008. That is a reliable topping pattern. However, wedge tops often have one more new high before there is a trend reversal down. Traders can see that this might be happening here.
In general, a breakout above a wedge top has a 50% chance of a measured move up and a 50% chance of a reversal down. The bulls want a measured move based on the distance from the October 2018 low of 133 27/32 to the July 2016 high of 165 15/32. That puts their measured move target at just below 200, which is a Big Round Number and another magnet.
The odds vary depending on the context. Here, the probability of a measured move up is only 30%. This is because the 2016 nested wedge top is a reliable pattern and the 2019 rally is reversing down strongly from a reliable buy climax top.
Low 4 Top
The 2019 rally formed a Low 4 top. There was a reasonable attempt to create a lower high in March after two legs up. That was a Low 2 top.
But there was then a strong breakout above that top and that breakout had two more legs up to a second Low 2 top. The weekly chart is now reversing down again from a second consecutive complex top (one with two or more legs).
When there is a Low 2 top, a bull breakout, and then a second Low 2 top, that is a Low 4 top. That is a second major top after the July 2016 rested wedge top. It increases the chance of a major trend reversal down.
Since the bull trend lasted about 30 years, a major reversal down will probably last at least half as long. Traders therefore should expect interest rates to work higher over the next couple decades.
No negative interest rates
What about all of the talk on TV about negative interest rates? The weekly and monthly charts are telling us that the consensus among institutions is that it will not happen.
Why do they keep putting experts on TV who say that it will happen? Because in general, those who talk don’t know and those who know don’t talk. The smartest people do not feel a need to be on TV. As a rule, those with actionable inside knowledge on markets, don’t give it away for free.
However, the charts are showing us what they believe. It is very different from what the TV pundits are saying. You get to choose whom to believe. I believe the institutions and not the TV stars.
Major trend reversals take time
There is currently a credible top on the weekly and monthly charts. But will it be the final top? It is too early to tell. A trend reversal from a 30-year bull trend into a 20-year bear trend is not going to be abrupt.
The current topping process began three years ago with the 2016 high. Traders should not be surprised if this current buy climax lasts many months and has a small higher high before there is a trend reversal.
The 2019 rally on the weekly chart was a parabolic wedge buy climax. A tight bull channel does not typically instantly reverse into a bear trend.
More often, a trend reversal down from a parabolic wedge top often forms a tight trading range that is tilted down slightly. The bulls see it as a bull flag. It can have 10 to 20 bars. The best the bulls can probably get over the next few months is a rally in trading range. Traders should expect sideways to down trading for many months.
On the weekly chart, it could easily last for the rest of the year. If this endless pullback type of reversal happens, traders will not conclude that the trend has reversed until there is a strong break below the bear channel. Therefore, while the top for the next 20 years might be in, traders need more evidence, which will take many more months.
Trading Room
Traders can see the end of the day bar-by-bar price action report by signing up for free at BrooksPriceAction.com. I talk about the detailed E-mini price action real-time throughout the day in the BrooksPriceAction.com trading room. We offer a two-day free trial.


