

Crude oil had a brief rally and then reversal down last week. The rally was strong enough to make at least a small test back up likely, writes Al Brooks.
Crude oil futures jumped 15% on Monday after the attack on Saudi Arabia’s oil production facilities. While dramatic, crude oil gave back half of the gain on the next day. As big a move as it was, it is not noticeable on the monthly chart and unremarkable on the weekly chart.
Crude has been in a tight trading range for four years. Furthermore, it has been forming lower highs and higher lows for two years. It is therefore at the apex of a triangle on the weekly chart.
Every tight trading range is a Breakout Mode pattern. The apex of a triangle is an example. Traders know that it is a balanced market. Control alternates between the bulls and bears.
What happens with a breakout from a Breakout Mode pattern? At some point, there is a breakout. Traders know three things about the breakout. First, there is a 50% chance that the first breakout will fail. Second, there is an equal chance that a successful breakout will be up or down. Finally, until there is a breakout, there is no breakout.
Most breakout attempts will reverse. They bet against breakouts by selling strong rallies and buying strong sell-offs. Additionally, since they believe moves up and down will not last, they take quick profits. This results in a continuation of the trading range.
Bull Surprise Bar
The Bull Surprise bar typically will lead to a second leg sideways to up.
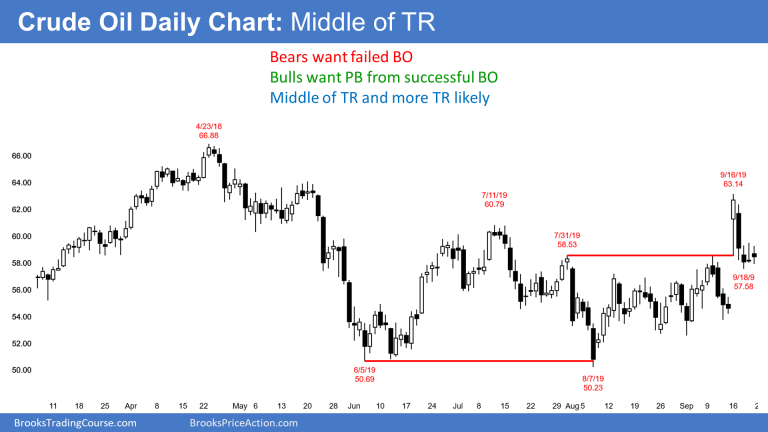
Last week’s rally was surprisingly strong on the daily chart (see below). A Surprise Bar or Breakout means that it was unlikely. Traders were therefore not positioned correctly for it.
There were bears who sold early in the bull breakout, betting it would not get far. Now that it has, these bears are trapped into a bad short. They will therefore buy this reversal down to exit their shorts with a smaller loss.
The bulls were also not expecting as big a bull breakout. Many did not buy but are hopeful that it is the start of a bull trend. These bulls will also buy this week’s pullback, but they are buying to get long.
There are other bulls who bought at the top of Monday’s rally. They were confident that either the rally would continue, and they could make a profit, or there would be a pullback and the chart would enter a trading range.
These traders believed that the rally was strong enough to make an immediate bear trend unlikely. They could then buy more lower and exit on a test back up to the top of the range. They would get out around breakeven on their first buy and with a profit on their lower buy.
With both the bulls and bears buying the reversal down, the odds favor a second leg sideways to up. Will the second leg up from a double top and then lead to a swing down for a few weeks? Or will it test the next resistance at the June high, just below $67?
In either case, most breakout attempts fail. Therefore, this rally will probably not lead to a trend up to the Oct. 3, 2019 high above $78. Big Up, Big Down creates Big Confusion. Traders expect more sideways trading between $50 and $65.
Trading Room
Traders can see the end of the day bar-by-bar price action report by signing up for free at BrooksPriceAction.com. I talk about the detailed E-mini price action real-time throughout the day in the BrooksPriceAction.com trading room. We offer a two-day free trial.


