

The EURUSD currency pair has traded sideways for three weeks at the bottom of its yearlong bear channel and likely will continue for the next few weeks, writes Al Brooks.
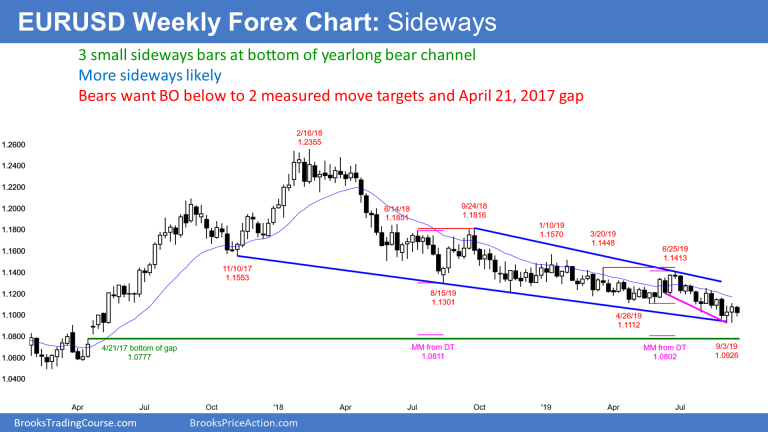
The EURUSD currency pair formed three sideways small bars over the past three weeks; two were dojis. This is a neutral pattern. Because the bars are sitting on the bottom of the yearlong bear channel, traders expect a bounce (see chart below). But their small bodies indicate that there is no enthusiasm for a reversal. Since they are going sideways at support, this week will probably be sideways as well.
A bear channel is a series of lower highs and lows. This channel has had many legs up and down, each lasting a few weeks. There have also been many tight trading ranges lasting for a month or two. The weekly chart is now in one of those periods.
The bulls want a reversal up to the top of the channel. That is currently around the 1.1250 Aug. 6 major lower high.
But they need more than that to end the bear channel. The June 25 high of 1.1413 is more major. Traders want to see a couple daily closes above that high before they will begin to conclude that the bear channel has ended and either a trading range or bull trend has begun. Since every rally over the past year led to a new low, traders will bet that any rally now will do the same.
Targets are near April 2017 gap below 1.08
There are two double tops with measured move projections down at around 1.08. The first is the July/September 2018 double top. The other is the March/June 2019 double top. Two magnets at nearly the same price increase the chance of a test of that support.
It is important to note that there is a third magnet around 1.08 as well. The daily and weekly charts gapped up on April 24, 2017. For the gap to close, the EURUSD will have to trade below 1.0777, which is the April 21, 2017 high. That is only about 30 pips below both measured move targets.
Furthermore, the first of the three targets is less than 100 pips below this month’s low. Support is a magnet. The closer something gets to a magnet, the stronger the magnetic pull. As some point, the magnetism is so strong that it is very difficult to escape the magnetic pull.
The EURUSD weekly chart is near that point. This bear channel will probably continue down to at least 1.08 over the next few months, even if there is a test of August high first.
Trading Room
Traders can see the end of the day bar-by-bar price action report by signing up for free at BrooksPriceAction.com. I talk about the detailed E-mini price action real-time throughout the day in the BrooksPriceAction.com trading room. We offer a two-day free trial.


