

While the Russell 2000 ETF IWM recently experienced a death cross, that does not always signal a huge drop, notes Andrea Kramer.
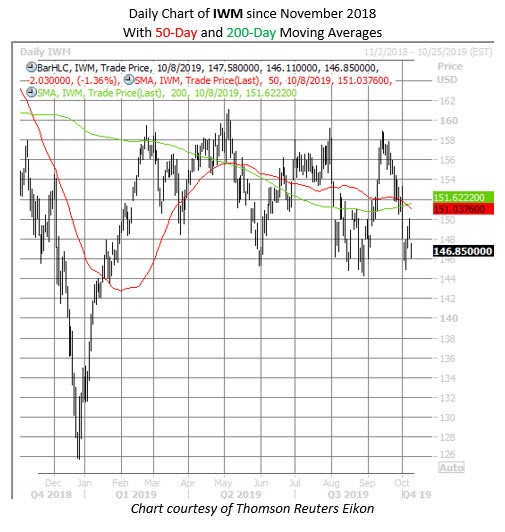
The U.S. small-cap focused iShares Russell 2000 ETF (IWM) recently experienced a "death cross" -- defined as its 50-day moving average crossing below its 200-day moving average while below it. The last time this happened, nearly one year ago, spelled bad news for stocks in the short term (see chart below). The indicator certainly lived up to its name a year ago.
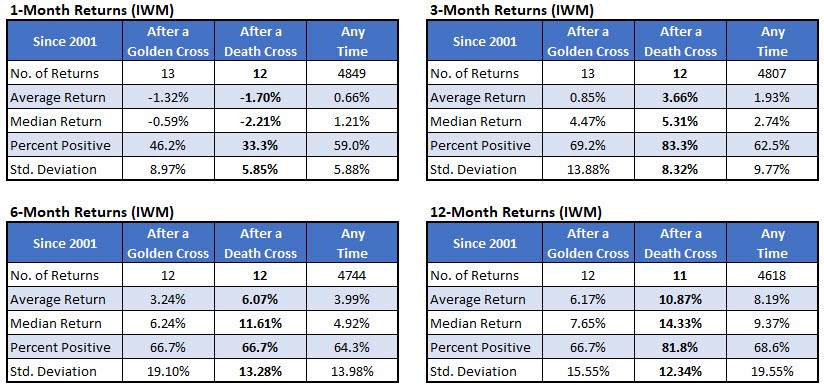
IWM bulls can take solace in knowing that death crosses haven't been nearly as foreboding as their "golden cross" counterparts (when the 50-day moving average moves above the 200-day moving average). Three months after a death cross, the IWM was up 3.66%, on average, compared to 0.85% after a golden cross, per data from Schaeffer's Senior Quantitative Analyst Rocky White. That also exceeds the exchange-traded fund's (ETF) average anytime three-month gain of less than 2%. In addition, the fund was higher after a death cross 83.3% of the time.
Likewise, six and 12 months after death crosses, the IWM's returns handily exceeded both those after a golden cross and at any time. In fact, a year after death crosses, the IWM averaged a healthy gain of 10.9%, and was higher 81.8% of the time (see tables).
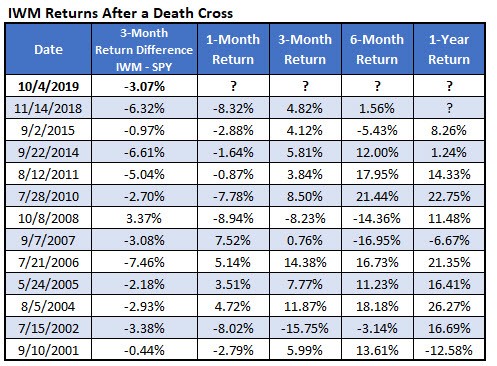
Meanwhile, last week's death cross occurred with the IWM down roughly 3% vs. the broader SPDR S&P 500 ETF Trust (SPY) over the previous three months. Likewise, the last time the IWM made a death cross, nearly one year ago, it had also underperformed SPY by 6.32%. In fact, looking at death crosses since 2000, there's been only one occurrence when the IWM had outperformed the SPY prior -- back in October 2008, at the height of the financial crisis (see table).
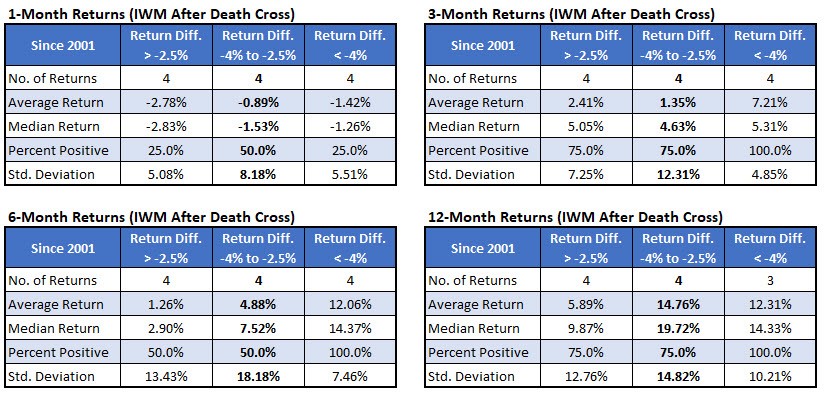
Digging deeper, the tables below compare IWM returns based on how the ETF performed vs. the SPY in the prior three months. The weaker the small-cap barometer performed vs. the SPY leading up to a death cross, the stronger it tended to bounce back.
When the IWM underperformed the SPY between 2.5% and 4% three months before a cross — what we'll call a signal — as it did on Oct. 4, it averaged a three-month gain of just 1.35%. That's compared to average gains of 2.41% and 7.21%, respectively, when the underperformance was below 2.5% or above 4%.
Six months after a signal, the IWM was up 4.88%, on average, but higher just half the time. That's compared to an average gain of 12.06% when the underperformance vs. the SPY was even more prominent, but still better than the ETF's average anytime six-month return of 3.99%.
However, a month after signals, the IWM was still in the red, but only lost another 0.89%, on average, and was higher half the time. That's compared to win rates of just 25% for the other two groups. Likewise, a year after signals, the IWM was up 14.76% on average, outperforming the other two groups, and much higher than the ETF's average anytime one-year return of 8.19%.
History suggests small-cap bulls shouldn't panic over last week's death cross, or the sector's recent underperformance.
Further, as Schaeffer's Senior V.P. of Research Todd Salamone noted recently, traders should expect more "messy action" in equity benchmarks, as a "plethora of uncertainties has been thrown at market participants, ranging from how the Fed will deal with slowing world growth and China-U.S. trade tensions, to the instability in Hong Kong and the Middle East, a potential presidential impeachment, Brexit, and others."


