

US 30-year T-bonds likely in a range after failing test of high, writes Al Brooks.
The U.S. 30-year Treasury bond futures had a buy climax in August. It will probably be sideways for at least several more weeks.
The 30-year Treasury bond futures weekly chart reversed down strongly in September after a buy climax in August (see chart). Big Up, Big Down typically creates big confusion. Since confusion is a hallmark of a trading range, traders should expect more sideways trading. The rally of the past three weeks tested the August high, but failed. This week reversed back down.
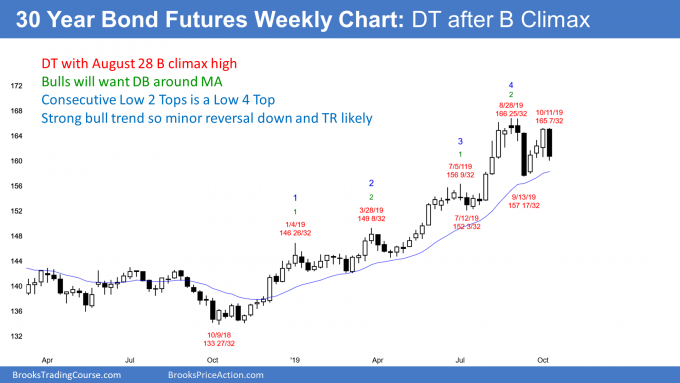
While the bulls regained most of the August loss, they have been unable to break to a new high. When there is a surprising strong selloff from a buy climax, traders expect at least a small second leg sideways to down. This week is the start of that leg.
Surprises trap traders in and out
Why do surprises trap traders? Because a surprise means a low probably event took place. That means many traders were on the wrong side. They used this rally to fix their positions.
The trapped bulls who bought at the August high were relieved to be able to exit around breakeven. That means there were bulls selling the rally. Other bulls bought the selloff in early September, expecting the reversal down to be minor. They now expect a trading range and therefore took profits around the top of the range (currently, the August high).
Bears are always looking to sell. Many missed the Aug. 28 short and therefore were trapped out. They know that bulls would sell a bounce to around the August high. Consequently, the bears expected at least a small pullback from the bulls exiting near the August high. They sold as well.
Buy zone is near the September low
There are probably enough bulls and bears selling around the August high to limit the upside near-term. The bulls want to buy again, but since the weekly chart is now probably evolving into a trading range, the bulls want to buy at support. Support is around the Sept. 13 low and the July 12 low at the bottom of the August buy climax.
The Sept. 13 low is the neckline of the August/September double top. But since a trading range is likely, the bears will probably not get a measured move down. Instead, there will probably be another bounce from the support zone.
Trading Room
Traders can see the end of the day bar-by-bar price action report by signing up for free at BrooksPriceAction.com. I talk about the detailed E[-mini price action real-time throughout the day in the BrooksPriceAction.com trading room. We offer a two-day free trial.


