

The EURUSD currency pair is having its strongest rally since the bear trend began in February 2018, writes Al Brooks.
Traders expect higher prices in the euro and will buy the first two- to three-week pullback.
The EURUSD had a buy signal bar three weeks ago for a nested wedge bottom on its weekly chart (see chart below). Last week was the third week up and the size of the bodies has been increasing. The bulls are becoming more confident.
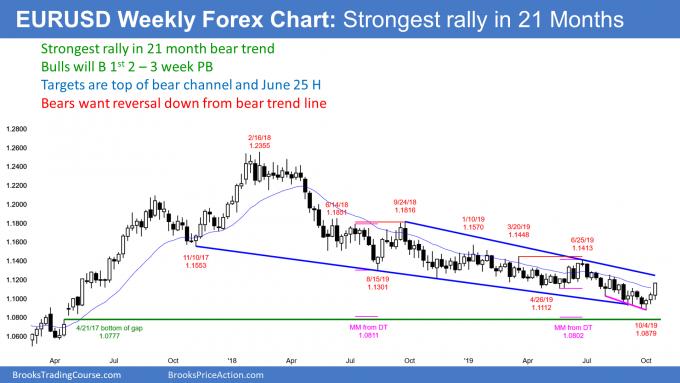
The bears want the rally to fail at the 20-week exponential moving average. But the momentum up is strong. The rally will probably continue up to test the bear trend line. That is the top of the yearlong bear channel. It currently is around 1.1250. That is also around the Aug. 6 minor lower high. Lower highs in a bear channel are resistance. They are therefore magnets when there is a reversal up.
A reversal up from a wedge bottom typically has at least two legs sideways to up. As a result, the bulls will buy the first one- to two-week pullback. Traders expect the weekly chart to be sideways to up for at least a few more weeks.
Is this the start of a bull trend?
Is this the end of the two-year bear trend? The nested wedge bottom and reasonably strong reversal up are good for the bulls. This rally is a credible candidate for the start of an evolution into a trading range for a couple months.
But the bulls need to do more before traders believe that the bear trend has ended. At a minimum, they need a couple closes above the June 25 major lower high. If they achieve that, traders will conclude that the bear trend has evolved into either a trading range or a bull trend.
What should traders expect
What happens in the meantime? Until the bulls clearly end the bear channel, the weekly chart is still in a bear trend. There are magnets below the October low at around 1.08. These are the gaps above the April 21, 2017 high and double top measured move projections in that area.
This rally is the first one since the 2018 high when the bulls have had three consecutive bull bars with big bodies and closing near their highs. That means the bulls are the strongest that they have been in two years.
But until there is a break above the June high, traders will assume that this rally is minor. That means either a bull leg in the bear trend or in a developing trading range. Because the two-year bear channel is tight, the weekly chart will likely have to go sideways for several months before the bulls can create a bull trend reversal.
A bear channel is a bull flag
It is important to note that 75% of bear channels have bull breakouts. Traders should view every bear channel as a bull flag because that is how most behave. Consequently, traders are confident of a bull breakout at some point.
If the bulls finally succeed this time, the rally should continue up to the June 2019 major lower high of 1.1413. It might even reach the June 14, 2018 high of 1.1851 over the next several months. That was the start of the bear channel in the Spike and Channel bear trend that began on Feb. 16, 2018. The spike was the two-month bear breakout down to the May 29, 2018 low. The channel began with the first pullback up to the June 14, 2018 high.
When there is a breakout above the bear channel in a Spike and Channel bear trend, the rally typically tests the start of the channel. The market then usually pulls back then enters a trading range.
Trading Room
Traders can see the end of the day bar-by-bar price action report by signing up for free at BrooksPriceAction.com. I talk about the detailed E-mini price action real-time throughout the day in the BrooksPriceAction.com trading room. We offer a two-day free trial.


