

The recent weakness in the 30-year bond has moved it close to a key support level it will likely test, reports Al Brooks.
The 30-year U.S. Treasury bond futures weekly chart will likely fall a little lower before its next bounce in its three-month trading range.
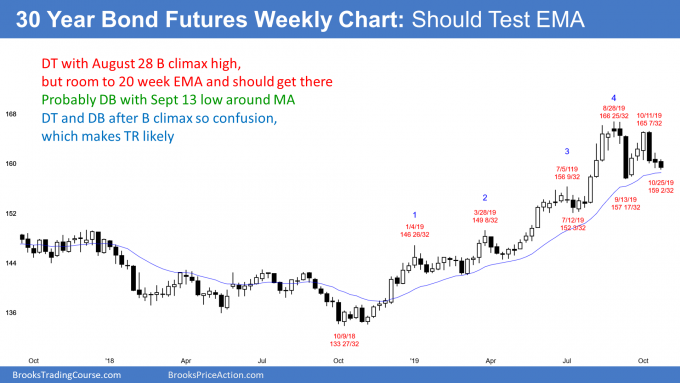
The 30-year has been sideways for three months after a buy climax to a new all-time high. The bears got a strong reversal down from a lower high double top three weeks ago (see chart).
However, the past two weeks have been small and have prominent tails in the weekly chart. This is an absence of strong follow-through selling. Also, these bars are forming a micro wedge bottom. This is a loss of momentum down just above the September sell climax low. Therefore, traders see the three-week selloff as a bear leg in a developing trading range rather than the start of a bear trend.
The Sept. 13 low was the bottom of the first leg down from the August buy climax. The bulls would like a reversal up from here. That would be a higher low double bottom bull flag in a bull trend. They would then want a rally back up to a new high.
However, there have now been two strong reversals down over the past seven weeks. A resumption of the bull trend up to a new high is not what bull trends typically do in this situation.
The 20-week EMA
Despite these reversals down, the chart has not pulled back to its 20-week exponential moving average. In fact, it has been above it for more than 30 bars (weeks). That is unusual and therefore unsustainable. Consequently, the chart will probably go sideways to down over the next few weeks until it gets there. The price action cannot deviate from the price for too long. They correspond to one another over time.
Why will market get there? Because traders buying now are paying an above average price. Yet, those two big selloffs tell traders that the price action is no longer above average in terms of its bullishness. Many bulls now want to wait to buy at the average price.
Consequently, if there is a rally from here, it will probably be small and not last more than one to two weeks. Traders will sell above last week’s high because they sense that the bears are getting strong. The bulls will probably be hesitant to pay an above average price. Traders should expect at least slightly lower prices and a test of the 20-week exponential moving average over the next few weeks.
Trading Room
Traders can see the end of the day bar-by-bar price action report by signing up for free at BrooksPriceAction.com. I talk about the detailed E-mini price action real-time throughout the day in the BrooksPriceAction.com trading room. We offer a two-day free trial.


