

While stock indexes could make a new all-time high, a correction could still be coming, note Avi Gilburt.
There is a significant amount of frustration from the bulls and bears alike as the market has been basically in a trading range for many months.
As the market began its rally off the December lows of 2018, my initial expectation was that we could top out as we headed into the March/April time frame.
Clearly, the market had other intentions as it extended the timing for my correction expectations, and in quite a similar fashion as to what we saw in 2014-2015. Yet, we are still well within the price target expectations I outlined at the end of 2018.
I expected at least a 20% correction in the S&P 500 last year once it broke below 2880. Before that correction began, my expectation was that the SPX could target 2200.
However, as we moved through November, I modified my downside expectation for the S&P to the 2285-2335 before another rally. And, as we now know, the futures hit a low of 2316 before the market began that rally into 2019.
As you can see in the chart below, which originally was posted in early December 2018, my a-wave bottom in my primary count was in the low 2300 region, followed by my b-wave rally expectations, highlighted by the upper blue box.
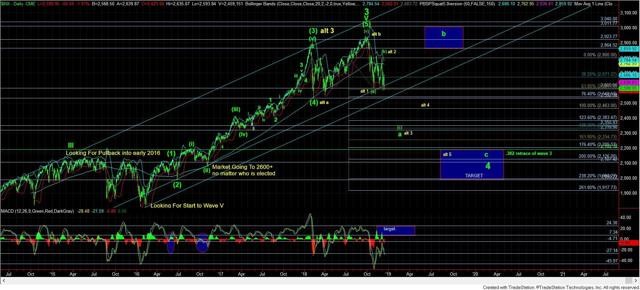
The market has followed our general expectations. Since that time, I have slightly modified my larger degree wave count, but my overall expectations remain the same for 2020. But, the one thing that has changed is that it could take much longer than I had initially expected.
I would suggest you review the market action from October 2014 through 2015. From the point the bottom was struck in October of 2014, the market seems to be an almost prefect fractal copy of what it experienced since the December 2018 low. For this, and many other reasons, I still maintain a minimum downside target of 2820 for the next decline phase, even if we see a new all-time high in the coming week or two.
Upper support now resides in the 2970-2990 region, and as long as we hold that support on corrective pullbacks, the 3040/45 resistance region remains in focus. However, should we see a break down below that upper support in the coming week or two, and see a sustained follow through below 2955, that should point us towards our minimum downside target of 2820 in the coming weeks.
The 2820 region is a minimum target. If we continue to follow the 2014-2015 market fractal, that decline can take us well below that minimum target. Yet, once that next decline completes a 5-wave downside structure, I expect us to rally back towards the all-time high again as we head into the first quarter of 2020, and even potentially make a higher all-time high.
The structure of the rally I expect into the first quarter of 2020 will tell us if we are ready to rally to our long-term target of 3800-4100 or if we are setting up for a secondary plunge in 2020 to a deeper 4th wave target. For now, my expectations follow the latter scenario.
We are stuck in the middle in the equity market. And, it will likely take several more months before the market makes its intentions clear as to whether we are going to rally to that 3800-4100 region sooner rather than later. My analysis right now points to later rather than sooner, but I will retain an open mind based upon what I see in the rally I expect into the first quarter of 2020 (but likely from lower levels).


