

The E-mini S&P gapped higher on Friday indicating continued strength, writes Al Brooks.
The E-mini S&P 500 gapped up on the monthly chart and the daily chart is in a Small Pullback Bull Trend. It will probably work higher for at least another month.
The E-mini S&P 500 futures traded below the September bar low in October and then above its high on the monthly chart (see chart below). October was therefore an outside up bar, which is a sign of strong bulls. Furthermore, it closed above the September high. That is even better for the bulls. Finally, it closed above the July all-time high. Therefore, October had the all-time highest close on the monthly chart. Traders should expect higher prices over the next few months.
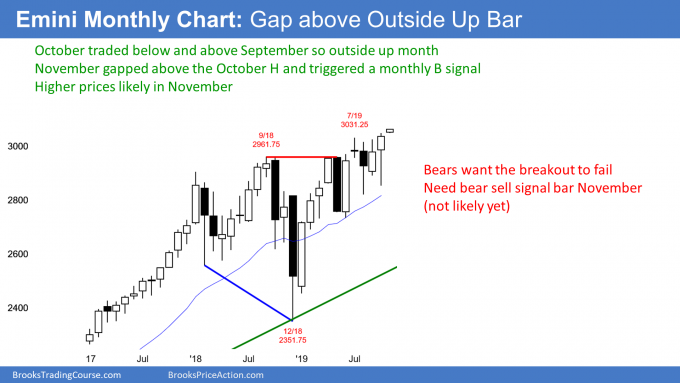
Can November form a sell signal bar?
An outside up bar in a bull trend is a buy signal. The buy signal triggered on Friday when the E-mini gapped above the October high. But if November then reverses, November would become a sell signal bar for December.
Gaps on the monthly chart rarely stay open. Consequently, the E-mini will probably trade back below the October high at some point this month. The gap might take five to 10 bars (months) to close.
It is important to note that the monthly and weekly charts are strongly bullish. If November forms a sell signal bar on the monthly chart, there will probably be buyers below. Traders should expect higher prices for at least another month or two.
Testing top of expanding triangle
The E-mini S&P 500 futures had its fourth consecutive bull trend bar on its weekly chart. It closed on its high and at a new all-time weekly high (see chart below). Traders will buy the first reversal down. They expect higher prices over the coming weeks.
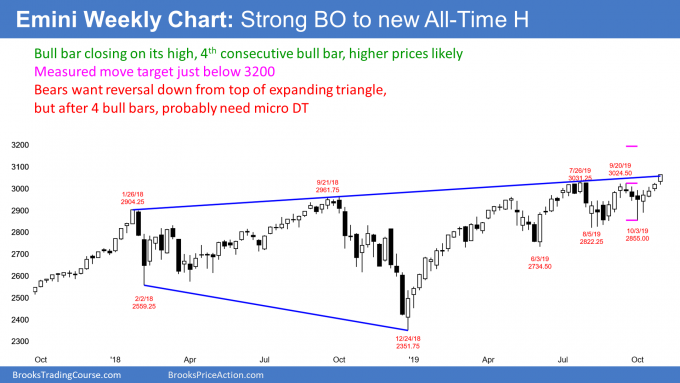
There is a 22-month expanding triangle top on the weekly (and monthly) chart. Last week broke slightly above the upper line. While the line might cause some hesitation, it is not strong enough resistance to abruptly stop the rally. The bears will need at least a micro double top before traders will look for shorts on the weekly chart. Traders expect the E-mini to trade sideways to up for the next several weeks.
Small Pullback Bull Trend
The E-mini S&P 500 futures gapped up to a new all-time high Friday on the daily chart (see below). In addition, it closed on its high. The October rally is accelerating now that the E-mini is breaking above the 22-month trading range.
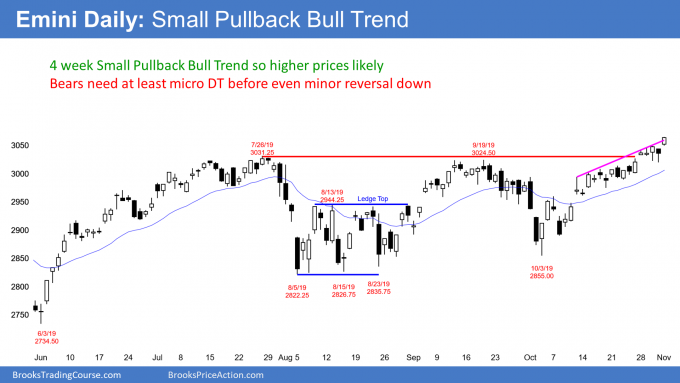
Every pullback for the past month lasted only a day or two. This is a Small Pullback Bull Trend. Higher prices over the next few weeks.
Bull trends do not go straight up forever. There will always be profit-taking that will cause a pullback. Sometimes the selloff can be strong enough to reverse the trend.
However, this rally is accelerating up in a parabolic curve. The bears have to stop it from continuing up before they can make it reverse down. That is a process that takes time. At a minimum, the bears typically need at least a micro double top, which takes a few days to develop.
But even that is usually not enough to reverse a bull trend. The bulls will buy the first reversal down, even if it is surprisingly strong. Most tops require a double top and not just a micro double top. The double top usually takes weeks to form. Consequently, the downside risk over the next few weeks is small.
What happens if the E-mini gaps down some day next week? Yes, there would be an island top, but most island tops are minor reversal patterns. Traders should expect the E-mini to be higher than it is now in a month, and probably in two months.
Trading Room
Traders can see the end of the day bar-by-bar price action report by signing up for free at BrooksPriceAction.com. I talk about the detailed E-mini price action real-time throughout the day in the BrooksPriceAction.com trading room. We offer a two-day free trial.


