

Multiple stock indexes made record highs last week with increased volume. A bullish sing but traders need to be mindful of news on US-China trade negotiations, warns Kerry Given.
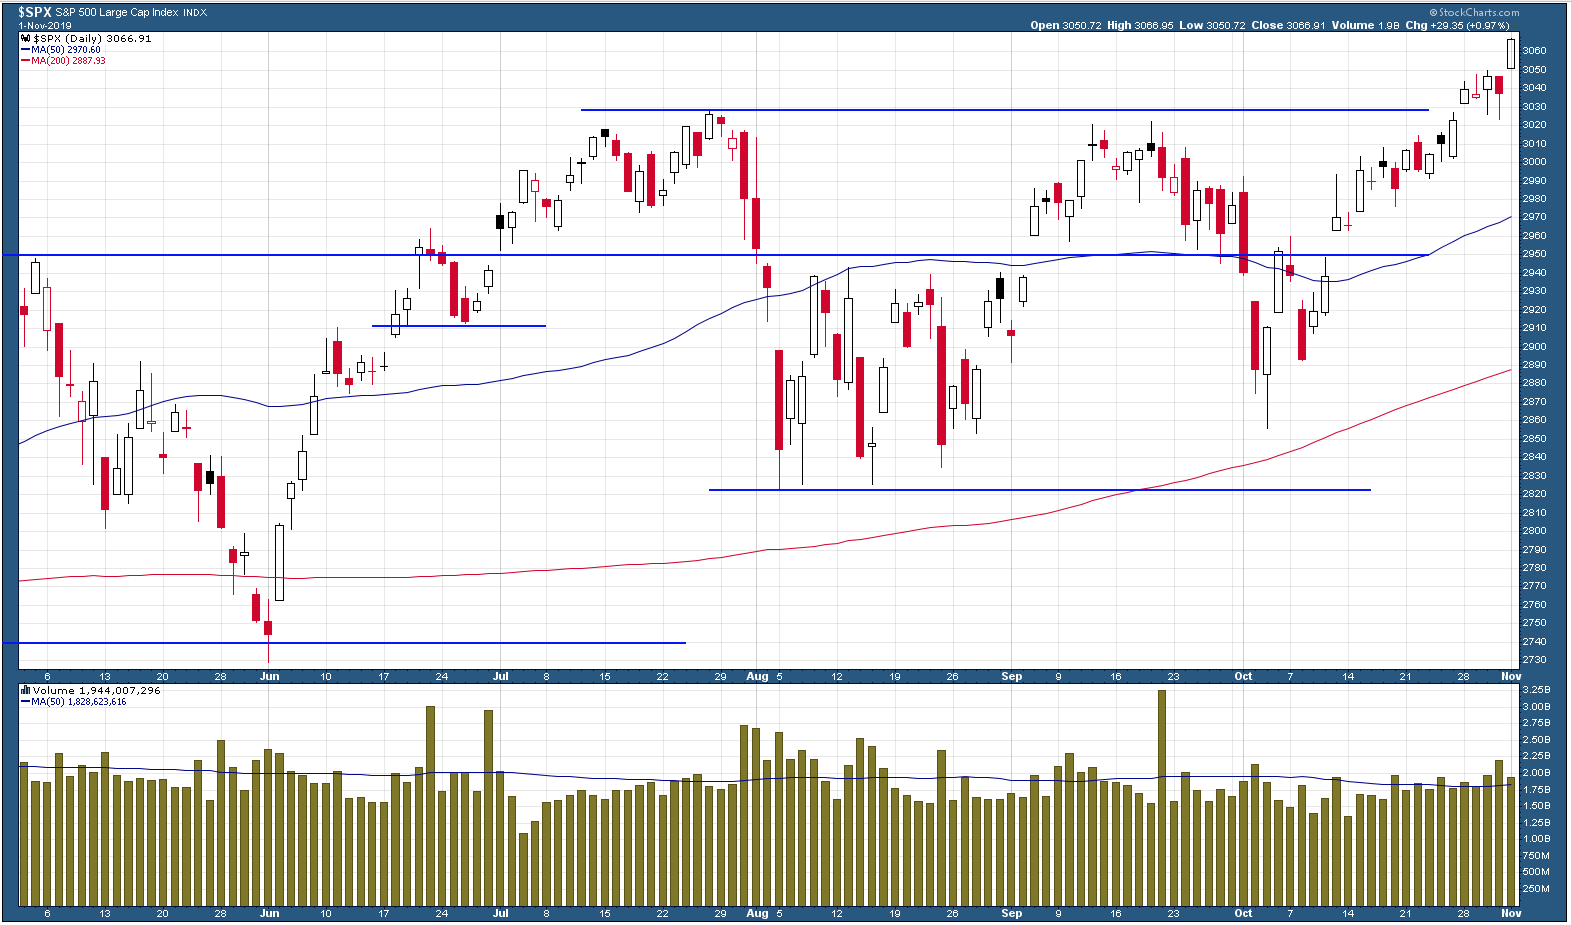
The S&P 500 Index (SPX) opened last week by setting a new all-time high at 3032 and then added 1.2% to close Friday at 3067, another all-time high. The choppy trading resulting from the China trade negotiations that has characterized recent weeks was generally absent last week. The bulls are in charge (see chart).
Standard and Poor’s 500 Index (SPX)
Chart courtesy of StockCharts.com
Unlike recent weeks, trading volume for S&P 500 broke above the 50-day moving average four days this week. That has not happened in a long time. Any move is stronger when it is accompanied by higher volume.
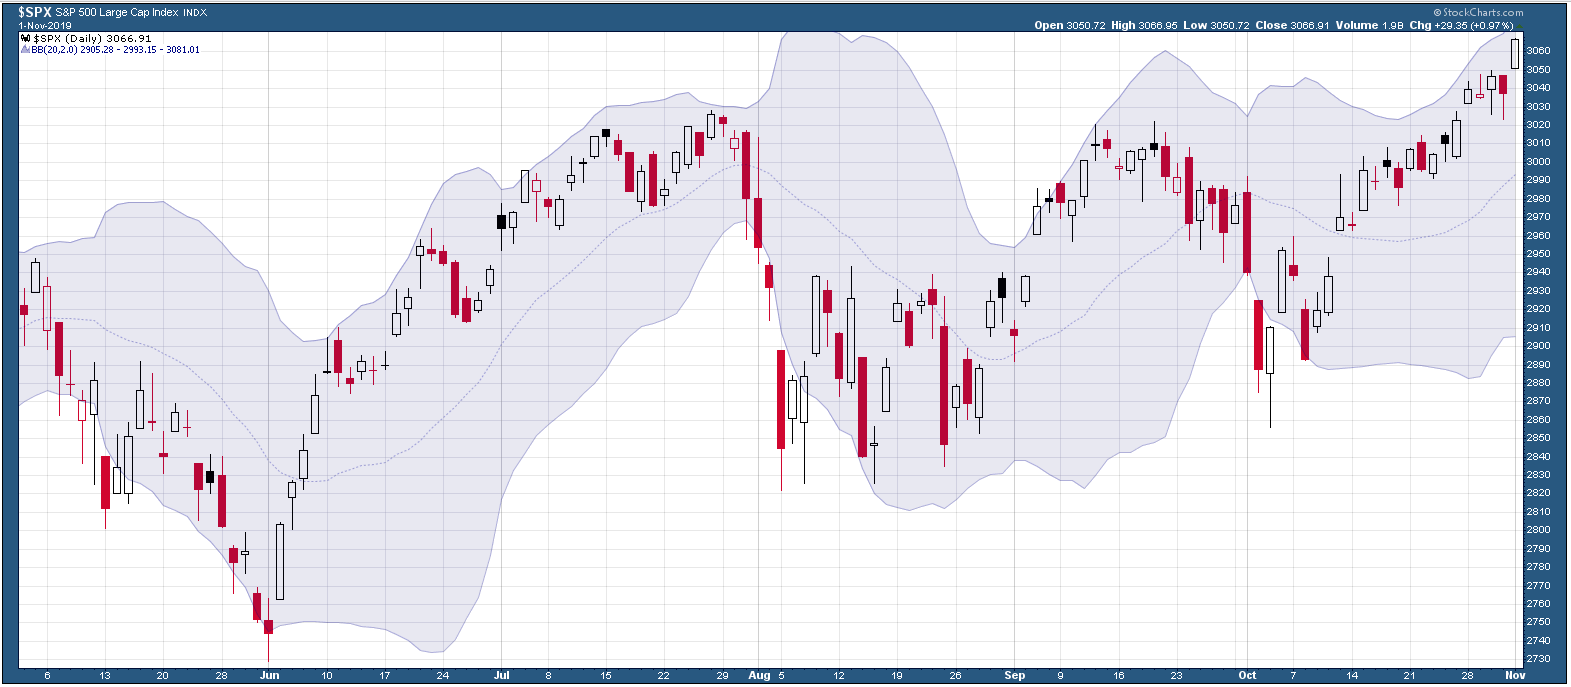
I have drawn the Bollinger bands on the SPX chart below with two standard deviations above and below the 20-day moving average. Last week’s trading took the market well into the upper quartile and close to that upper edge of the bands. Statistically speaking, we may be due for a pause or slight pull back.
SPX with Bollinger Bands
Chart courtesy of StockCharts.com
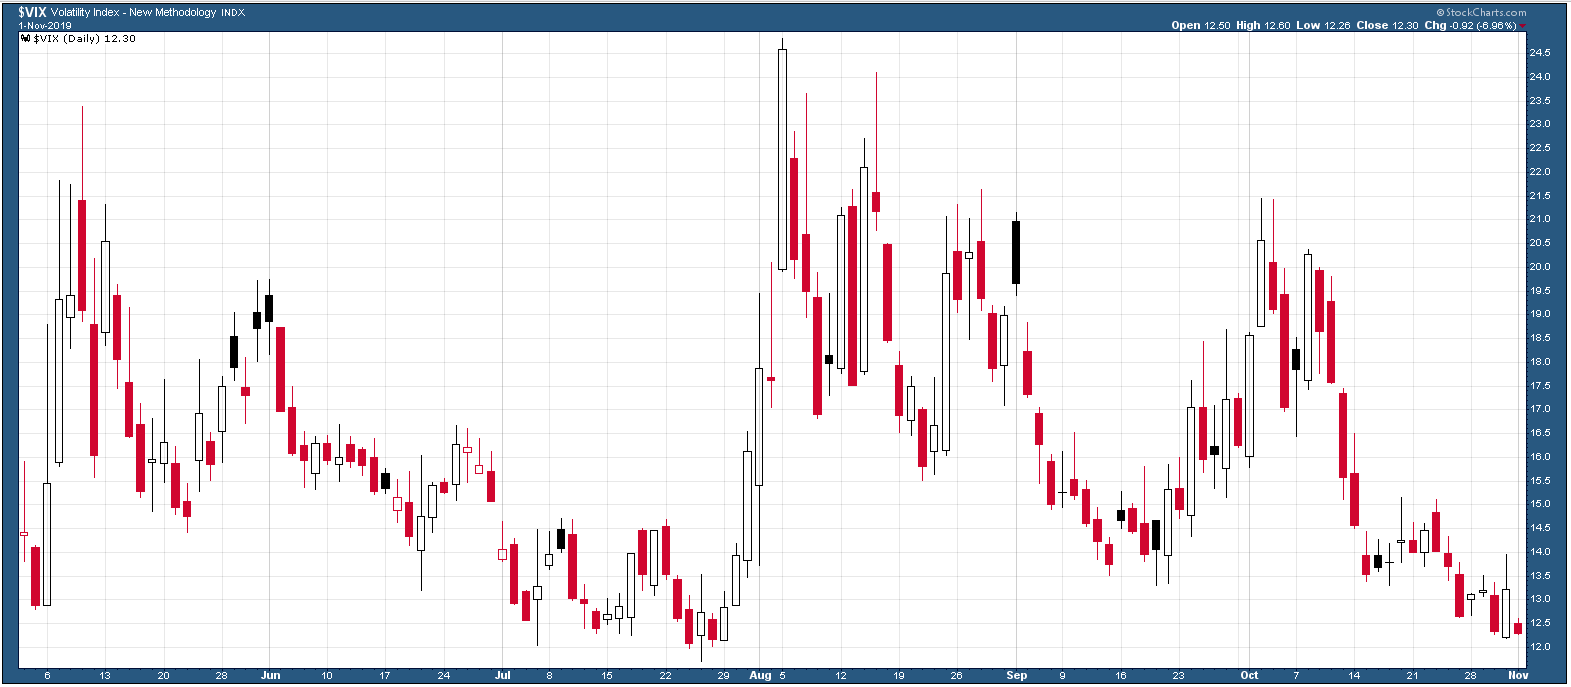
The Cboe Volatility Index (VIX) opened the week slightly above 13% and steadily declined to close the week at 12.3%. Volatility hasn’t been this low since July. The market apparently isn’t too concerned about the China trade negotiations and all the breathless impeachment talk.
CBOE SPX Volatility Index (VIX)
Chart courtesy of StockCharts.com
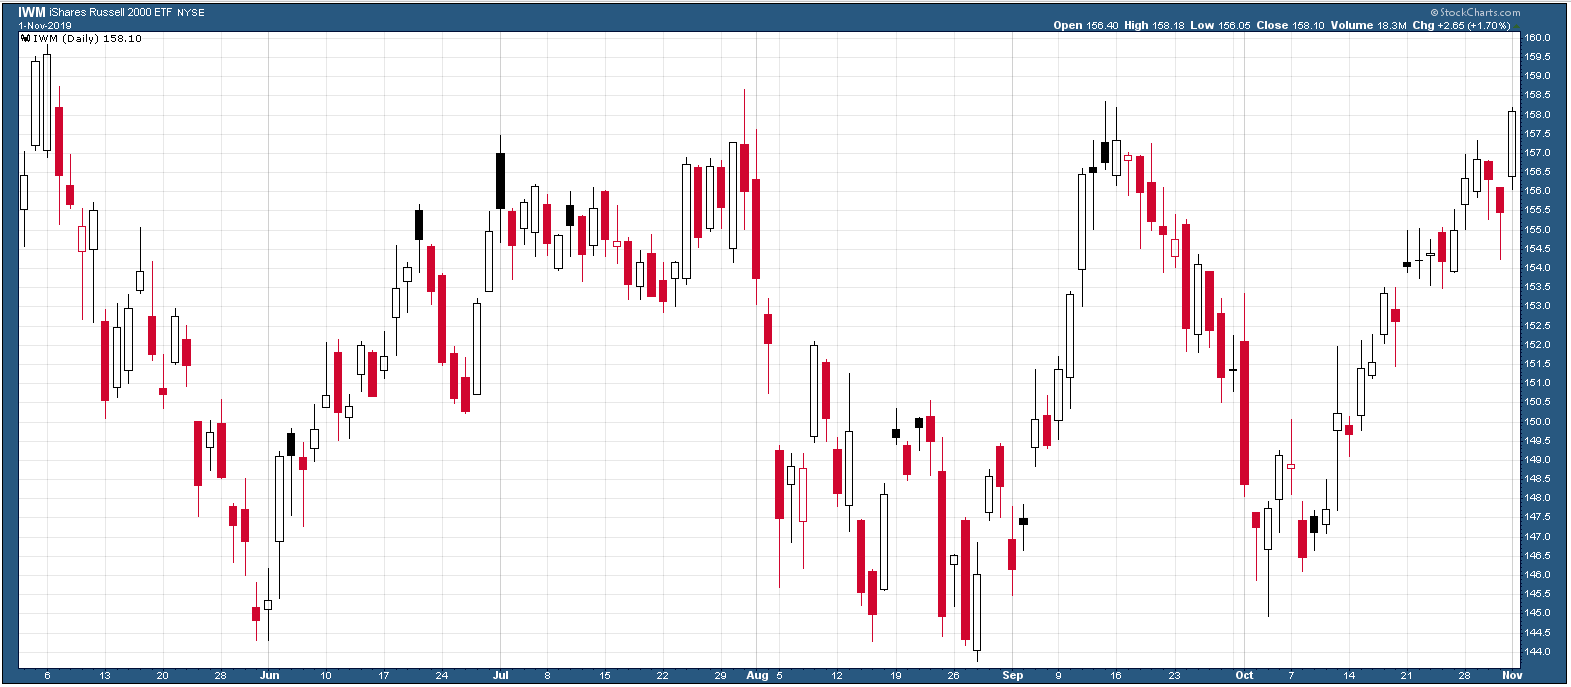
I have always used the Russell 2000 Index (RUT) to track small capitalization stocks and compare those performances to the large cap blue-chip stocks of the S&P 500. With data on intraday pricing for RUT options getting expensive, I am changing over to tracking the price of the iShares Russell 2000 ETF (IWM), which is based on the Russell 2000 index. IWM is roughly one tenth the price of the Russell index (similar to the relationship of SPX and SPY). IWM closed at $158.10 on Friday, and RUT closed at 1589.33. The minor differences in price are due to the stocks in the Russell 2000 index being weighted by shares outstanding whereas IWM contains shares of the Russell 2000 companies weighted by market capitalization.
IWM broke through the previous highs from September and July, and closed Friday at 158, up 3 points. IWM remains well below its all-time high of 171 from August 2018.
IWM Exchange Traded Fund (ETF)
Chart courtesy of StockCharts.com
The NASDAQ Composite index gapped open Monday morning at 8286 and proceeded to add another 1.2% to close at 8386, up 94 points on Friday. This represents another all-time high for NASDAQ.
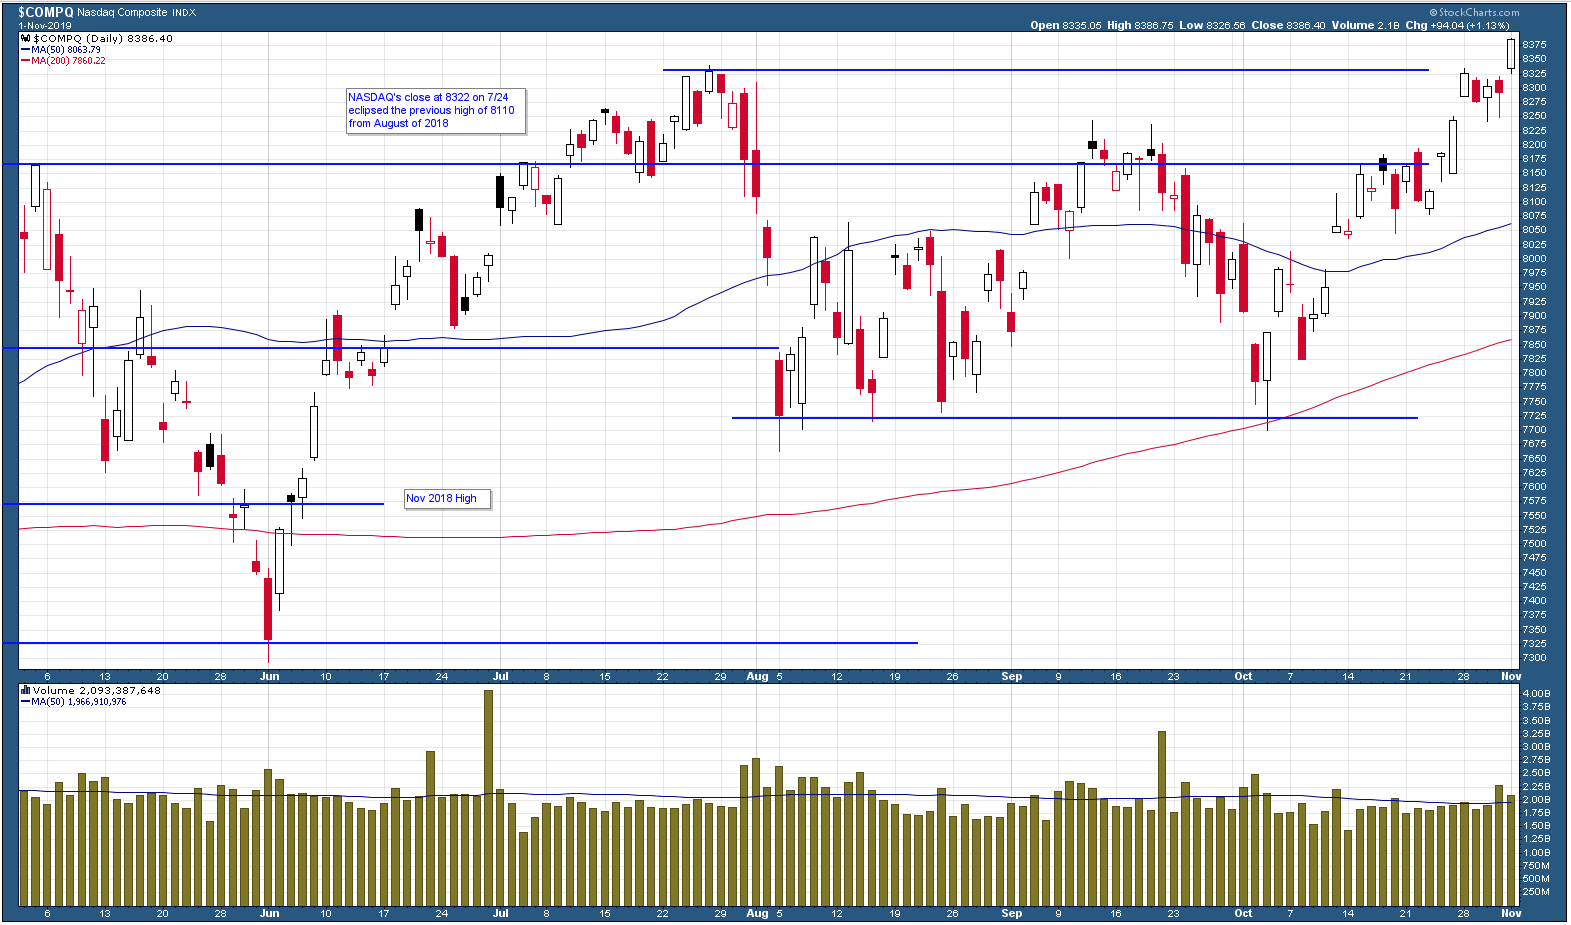
NASDAQ Composite Index
Chart courtesy of StockCharts.com
NASDAQ trading volume hit the 50-day moving average on Monday and traded above the average Thursday and Friday.
Last week brought us several bullish signals, and we finally are beginning to see some increased trading volume. Money is coming in off the sidelines. An even more bullish signal came from IWM.
The Russell 2000 components, all domestic small cap stocks, outperformed both the S&P 500 and NASDAQ last week, up 1.3%, as compared to 1.2% for SPX and NASDAQ. SPX and NASDAQ set new all-time highs last week and the Dow Jones Index is one point away from setting a new all-time high. Several of these broad market indices displayed multiple gap openings higher this week – all in all, a very bullish week.
My caution is beginning to diminish a bit and I am putting more of my cash to work. However, I won’t be strongly bullish until we settle the trade dispute with China. Some negative news on that front could hit the market at any time. On the other hand, a signed deal would spike this market higher. Stay alert. Whenever possible, use trailing stops to protect your gains.
Parkwood Capital, LLC, Learn more about The No Hype Zone Newsletter
Come hear Kerry talk options and investing for retirement at the Las Vegas TradersEXPO on Nov. 9
Kerry W. Given, Ph.D.


