

E-mini S&P rally traps bears, reports Al Brooks.
The E-mini S&P 500 rallied strongly from a two-day bear trap. The bears now want a double top, but sideways to up is more likely.
The E-mini S&P 500 futures is forming a doji bar on its monthly chart in December. The bears want the month to close on its low. It would then be a credible sell signal bar for a wedge rally in 2019 and for a reversal down from the top of the 13-year bull channel (see chart below). At the moment, this is unlikely.
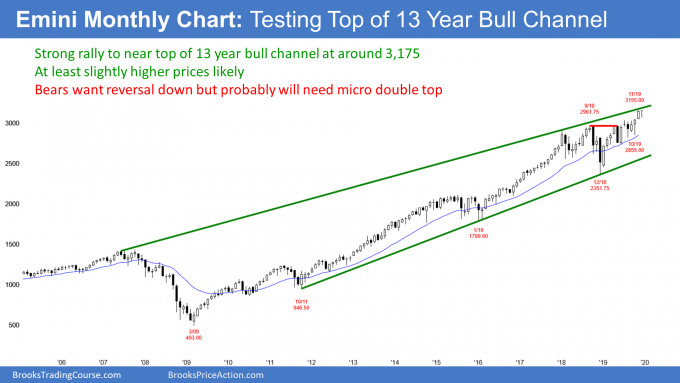
The year has been in a tight bull channel, despite the wedge rally. When a tight bull channel reverses, the reversal is usually minor. Consequently, the best the bears can probably get over the next couple months is a pullback and not a bear trend.
Yes, 2019 was in a tight bull channel. That is good for the bulls. But look at the bars. Many of the bull bars had prominent tails below and several others were dojis or bear bars.
When a rally looks like that, it typically will end up being a bull leg in a trading range. That means that there would be a bear leg within about five bars. But five bars are five months, and the E-mini could go considerably higher in the meantime. The bottom of the developing range is the 2019 low at around 2400. If there is a bear leg, that becomes a reasonable target later next year.
Rally to evolve into a trading range
A tight bull channel usually does not reverse into a bear trend. More often, it first has to stop going up and begin to go sideways. At that point, the bears will try to create a double top or a micro double top. If they get that, they then will have a better chance of a bear trend.
Since this is a monthly chart, several sideways bars mean several months. As a result, the downside risk over the next few months is not great.
But remember, this rally looks like a leg in what will become a trading range. Therefore, the upside potential from here is also not big. Traders should expect mostly sideways bars for a few months. That means maybe a bar or two down or a bar or two up, but not a strong trend either way.
The E-mini S&P 500 had been in a micro channel until this week on the weekly chart (see below). Once last week’s bar traded below the previous week’s low, it became the first pullback in nine weeks. It therefore ended the micro channel.
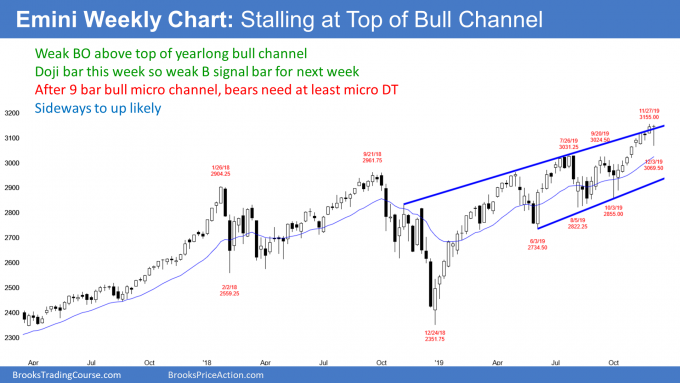
A micro channel means that the bulls were so eager to buy that they were buying above the prior week’s low. They were not waiting for a pullback. Once they finally get a pullback, they typically buy it. That is what happened last week. Despite the strong selloff on Monday and Tuesday, the bulls bought. The rally completely retraced the selloff at the start of the week. Traders should expect either a trading range or slightly higher prices over the next few weeks.
For the bears, last week was a sell signal bar for a reversal down from the top of a yearlong bear channel. That channel is different from the monthly bull channel, which is 13 years long. It is also different from the two-month bull channel on the daily chart.
Yes, last week was a sell signal bar on the weekly chart, but it had a bull body. That is a weak sell signal bar. In addition, the context is bad for the bears. Traders know that the bulls would buy the first pullback. As a result, I said last week that this was a weak sell setup and that there would probably be more buyers than sellers below last week’s low.
Many of the bulls who bought last week’s low knew that the selloff might fall 100 points. They scaled in lower. Since last week was a bad sell signal bar, a bull buying below last week’s low, scaling in lower, and using a wide stop had an 80% chance of not losing money, and a very good chance of making money.
When the rally went back above last week’s low on Wednesday, those bulls could exit their first buy at breakeven. They could exit their lower buy with a profit.
High 1 bull flag, but doji bar
The bulls bought aggressively this week and retraced Monday and Tuesday’s selloff. The week closed around the open and it was a doji bar on the weekly chart. It was a brief pause in a bull trend. However, last week is still a buy signal bar for this week. It is a High 1 bull flag.
But a doji is not a strong buy signal bar. Many bulls will prefer to buy another pullback instead of buying at the high. There might be a relative lack of bulls buying above last week’s high. Consequently, a rally above last week’s high might not get too far. That doji bar increases the chance of some sideways trading over the next week or two.
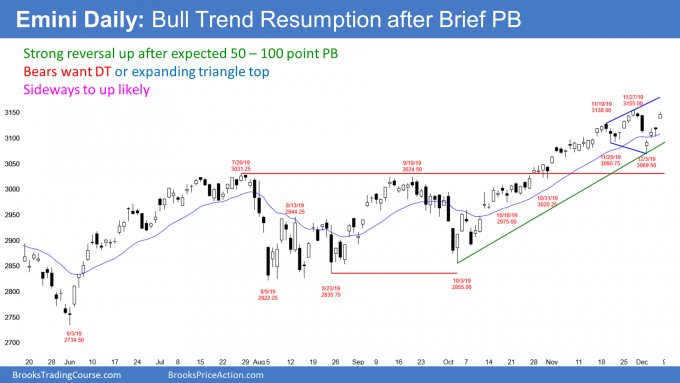
The daily E-mini chart broke strongly below the two-month tight bull channel this week (see below). However, it also reversed up strongly. This is a small version of what took place last Christmas. There was a huge selloff, but it was a bear trap. The bulls bought it aggressively and got a strong bull trend for all of 2019. But this bear trap is less certain because it is at the top of a buy climax and not at the bottom of a sell climax.
Problems for the bulls
The bulls once again are hoping that last week’s selloff was another bear trap. They want the two-month bull trend to quickly resume and for the year to close at a new high.
But there are problems with their reversal up. The buy signal bar on Tuesday was not especially big. Wednesday was the entry bar and it was only a small bull bar. Also, it had a prominent tail on top. Thursday was the follow-through bar and it had a bear body. Friday was good, but it did not break strongly above last week’s all-time high. Traders will wonder about a double top, especially if the E-mini stalls here for a few days. If there is a reversal down within a few days after a new high, there would be an expanding triangle top.
Problems for the bears
The bears got a big bear bar on Monday and a gap down on Tuesday. The selloff broke far below the two-month bull channel. A strong reversal down from a climactic rally typically has at least a small second leg sideways to down.
However, the E-mini completely retraced the selloff. Very often, a break below a trend line forms a higher low. Traders then redraw the line. The result is a broader, less steep bull channel. But it is still a bull trend, and not the reversal down that the bears wanted.
Next, the two-month rally was in a tight bull channel. A tight bull channel does not typically immediately break into a bear trend. There is usually a transition in which the market goes sideways for at least five to 10 bars. The bears are hoping that this week’s reversal up will be part of that transition. They need a double top with last week’s high.
Who will win?
With problems for both the bulls and the bears, which side will take control? In general, a strong reversal down from a buy climax has at least a small second leg sideways to down.
However, when there is a surprisingly big selloff like we saw on Monday and Tuesday, there is often a strong rally back up. Many bulls see the selloff as overdone and they buy what they believe is a brief discount. Many bears are surprised to quickly get a big profit and they buy back some or all of their shorts. This buying by both the bulls and the bears often reverses most or all of the initial selloff. That is what we saw this week.
The momentum up this week favors the bulls. So does the strong bull trend on the daily, weekly, and monthly charts. If the bears can get the E-mini to go sideways for a few days, they will have a 40% chance of a reversal down to last week’s low. But they only have a 30% chance of a strong break below that low and then a measured move down. For them, there will be a double top. However, a trading range is still more likely than a trend reversal down.
If there is a second leg down, can it grow into a bear trend? Unlikely. With the bull trend as strong as it has been on the weekly and monthly charts, the odds favor sideways to up over the next month or two.
The E-mini will probably have to go sideways for at least a couple months before the bears could have a good chance of creating a bear trend. Consequently, the odds continue to favor sideways to up.
Trading Room
Traders can see the end of the day bar-by-bar price action report by signing up for free at BrooksPriceAction.com. I talk about the detailed E-mini price action real-time throughout the day in the BrooksPriceAction.com trading room. We offer a two-day free trial.


