

E-mini S&P bull breakout will likely fail, but S&Ps are still looking strong, reports Al Brooks.
The E-mini S&P 500 finally broke above the tops of the bull channels on the daily, weekly and monthly charts. The bulls want the year to close on its high after opening on its low. Because there is no credible top, the E-mini will probably be sideways to up through December.
The E-mini S&P 500 futures chart finally broke above the top of its 13-year bull channel last week on its monthly chart (see below). The breakout is small so far, but there are many days left in the month.
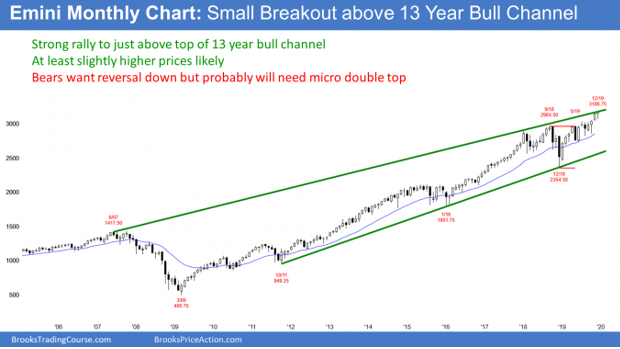
We have noted for a while that the breakout was likely, while cautioning that there is only a 25% chance the breakout would sustain itself above the top of a bull channel. By that, I mean an acceleration up into a stronger bull trend. The most dramatic example was the monthly chart in 1995. That breakout above a bull channel led to a huge bull trend.
In 75% of cases, there is a reversal down back into the channel within about five bars. An example of a reversal from a failed bull breakout above a bull channel happened in January 2018 on the weekly chart. The E-mini eventually sold off 20% and went sideways for almost two years.
Five bars on the monthly chart is almost half a year. Therefore, the E-mini could continue up for several more months before reversing down.
Breakouts usually overshoot
A breakout of a trend line or channel line on the monthly chart often goes several percent beyond the line before reversing. Therefore, this rally could continue up for 100 or more points before there is a swing down.
A swing down does not mean a bear trend. More often, the reversal down from above a bull channel is the start of a trading range. A common target is the middle of the channel.
The monthly chart had been in a trading range for two years. There was a smaller range within that range for seven months in 2019. The bottom of that smaller range is the June low around 2800. If there is a reversal down within the next six months, that would be another reasonable support level.
The E-mini S&P 500 finally pulled back two weeks ago after nine weeks without a pullback on the weekly chart. A nine-bar bull micro channel means that the bulls are very happy to buy for any reason (see chart below).
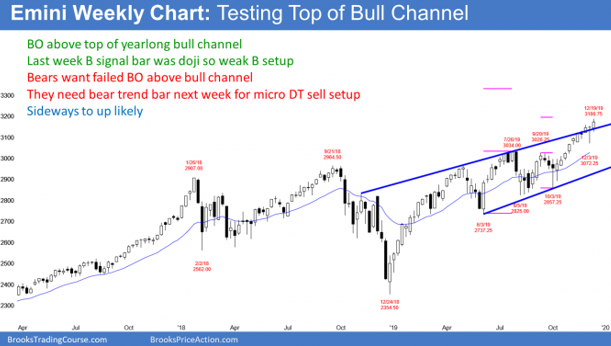
That is why I have been saying for more than a month that the first pullback would only last one to two weeks and only fall 50 to 100 points. The bulls were eager to be able to buy below the low of the prior week. And they did. The E-mini reversed up strongly from an 85-point selloff two weeks ago.
Since two weeks ago was a pullback in a strong bull trend, it was a High 1 buy signal bar. I said then that this past week would probably go above the previous week’s high and trigger the buy signal.
Furthermore, I said that the all-time high from two weeks ago was only a few points higher. That made it likely that a breakout above the high from two weeks ago would also break to a new all-time high. That is what happened on Thursday.
Higher time frame buy signals
In the chat room on Thursday, I talked how the rally was very strong and it broke far above the prior week’s high. But I also said that when a higher time frame buy signal triggers, there is usually a pullback to below the top of the buy signal bar. Despite Thursday rallying about 25 points above the prior week’s high, the E-mini then sold off briefly to below that high.
There was one other point that I made above last week. I said that when a buy signal bar has a small body and a big tail, the setup is weak. That often results in a weak entry bar. A weak entry bar either has a big tail on top or it has a bear body.
Last week had a prominent tail on top, which was likely. However, the weekly chart is still in a strong bull trend. Therefore, the odds still favor higher prices, even if the E-mini goes sideways or pulls back for a week or two first.
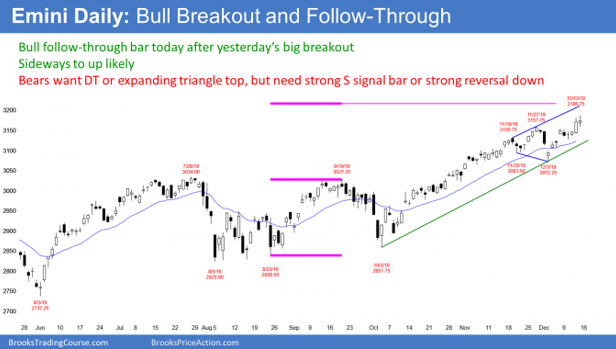
The daily chart had a big rally to above the top of a 13-year bull channel on Thursday. Friday had a bull body and it therefore confirmed the breakout. It increases the chance of at least slightly higher prices through December. However, Thursday was climactic and there might be a few days of sideways to down trading first.
The monthly chart is at the top of its bull channel, which is resistance. But, the next significant resistance on the daily chart is a measured move target based on the Aug. 5/Oct. 3 double bottom. The measured move projection is 3216.
If the E-mini reverses down before reaching that target, traders would say that it formed an expanding triangle top. Nov. 19 and Nov. 27 are the other two highs in the pattern. Since the space between the second two highs is much greater than that between the first two, traders will conclude that the pattern is not reliable.
Any reversal down will be minor
What will happen if the E-mini reverses down on the daily chart within the next month? The first targets are always the bull trend line, the 20-day exponential moving average, and the most recent higher low, which came on Dec. 3. When there is a reversal down from an expanding triangle top, the first target is the bottom of the triangle, which is that Dec. 3 low.
Below that, support is the breakout point. That is the neckline of the double bottom, which is the Sept. 19 high of 3027.25.
When a bull trend is as strong as the 2019 trend has been, traders expect reversals to be minor. That means that a trading range is more likely than a bear trend. Therefore, traders should expect sideways to up prices over the next month or more. Any reversal down will probably be minor.
Trading Room
Traders can see the end of the day bar-by-bar price action report by signing up for free at BrooksPriceAction.com. I talk about the detailed E-mini price action real-time throughout the day in the BrooksPriceAction.com trading room. We offer a two-day free trial.


