

The four-month selloff in the 30-year U.S. Treasury bond futures is stalling, writes Al Brooks.
There will probably be a bounce in the long bond over the next couple weeks.
The 30-year U.S. Treasury bond futures has sold off for four months from a 10-year nested wedge buy climax on the monthly chart (the chart above is a weekly chart). For three years the bond market appeared to be putting in a major top. By major, I mean that the high will last 10 to 20 years. That means traders should expect interest rates to work higher over the next decade.
But I keep making the point that a major top on the monthly chart can take several years to complete. Have we seen the top? We might have, but the yearlong bull channel was tight. That reduces the chance that the current four-month selloff will continue straight down to below the October 2018 low. That is where the tight bull channel began.
Instead, it is more likely that the bond market has entered a trading range that could last for all of 2020.
Bear trend?
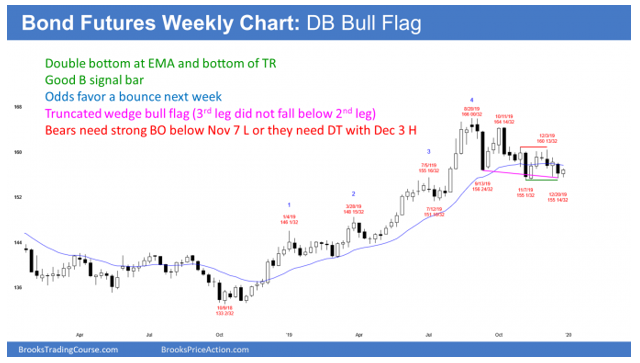
On the weekly chart above, there have been three legs sideways to down. If the current leg falls below the bottom of the second leg, the bears will try for a strong breakout. They then would want a measured move down.
It is more likely that there will be buyers around the start of the most recent buy climax. That is the August low. The most recent buy climax low is a common target when there is a reversal down.
The weekly chart has been mostly sideways for a few months, even though it is sloping down. This is an early trading range.
Furthermore, the monthly chart has had four consecutive bear bars. That is extreme, especially after such a strong rally in 2019. These factors make more sideways trading likely over the next several weeks.
Possible truncated wedge bottom
The current four-week leg down does not have to fall below the bottom of the second leg down (the Nov. 7 low). Instead, the bonds could reverse up next week. This leg down would then form a double bottom with the November low.
I would also call the four-month selloff a truncated wedge. This is when a chart looks like it is going to form a wedge bottom. However, the third leg down reverses up from just above the bottom of the second leg down. The forces are the same as in a wedge. I therefore like to use the term “wedge.” But since the third leg failed to fall below the second, the wedge is truncated.
This means that traders were very confident that there would be a reversal up from below the second leg. In fact, they were afraid that the third leg might not get there. Because the bulls did not want to miss the rally, they began to buy above the bottom of the second leg.
Also, the bears who were hoping to take profits below the second leg were worried that there was not much momentum down. They were concerned that they might not be able to exit their shorts below that second leg. They, too, begin to buy just above the bottom of the second leg down.
If there are enough buyers, the third leg fails to break below the low of the second. Therefore, the wedge bottom is truncated. But since it is still a wedge variant, traders expect at least a couple legs sideways to up.
Strong selloff — minor reversal up
It is important to note that the weekly chart has been sideways for 11 weeks. Consequently, a bounce could test the top of this developing trading range over the next few weeks. Traders should expect either a bounce from here or from just below the Nov. 7 low.
But after four consecutive bear bars on the monthly chart, any rally will probably be minor. That means that the trading range should last for at least another month.
Trading Room
Traders can see the end of the day bar-by-bar price action report by signing up for free at BrooksPriceAction.com. I talk about the detailed E-mini price action real-time throughout the day in the BrooksPriceAction.com trading room. We offer a two-day free trial.


