

The EURUSD currency pair is stalling at the top of a six-month trading range, writes Al Brooks.
Traders are wondering if the two-year bear trend has ended and a yearlong trading range has begun. It will probably be in a trading range from around 1.08 to 1.18 for the next year.
The EURUSD currency pair reversed down last week after breaking above the October high on the weekly chart (below). That is the top of the six-month trading range. However, the bears were unable to create a big bear bar closing on its low. Consequently, last week is a weak sell signal bar for this week.
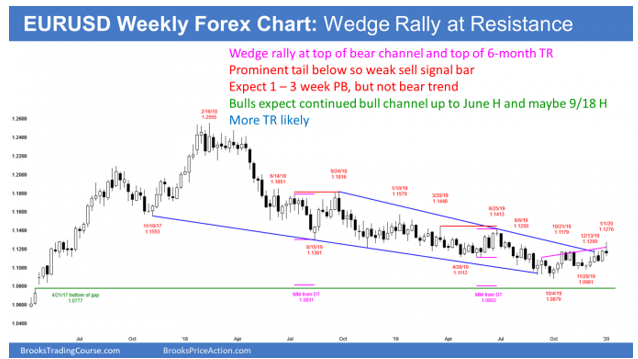
While the three-month rally has been the strongest rally in two years, it still looks like a bull leg in a trading range. It lacks relentless buying. The bulls need more consecutive bull bars, more bull bars closing on their highs, fewer bear bars, and fewer bars with tails above and below. Without those features of a trend, traders will continue to look for reversals every two to three weeks.
Because the 18-month tight bear channel on the monthly chart is unusually long, traders should expect an evolution into a trading range this year. The top of the range will probably be around the September 2018 high. That was the start of the bear channel and it is near the 1.18 Big Round Number. The bottom will either be the October low, or just a little lower at the 1.08 Big Round Number.
Trading Room
Traders can see the end of the day bar-by-bar price action report by signing up for free at BrooksPriceAction.com. I talk about the detailed E-mini price action real-time throughout the day in the BrooksPriceAction.com trading room. We offer a two-day free trial.


