

While the outlook for gold and precious metals remain bullish, a correction is due, notes Avi Gilburt.
Back in October and early November, I was preparing our members for the next rally phase in the metals complex. When the 144-minute MACD indicator on the silver chart signaled a bottom in early December, I noted it was no longer time to look down, but we need to be looking higher. Since then, the complex has provided us a nice return on that assessment.
While positive sentiment has risen for the market of late, I still think most of the signals and structures suggest this rally will last through 2020 — but not without a pullback. In fact, the recent pullback in the SPDR Gold Shares ETF (GLD) should be watched closely over the coming weeks.
Over the last year, I have tried to outline the one pattern which can still take us to levels lower than what was seen in late 2015 in the metals complex. That structure would suggest that this rally is a c-wave within an a-b-c corrective rally off the 2015 lows. And, as GLD approaches the 150 region, the Fibonacci Pinball structure in the GLD can easily be interpreted as a 5-wave structure off the 2018 lows. In fact, the high seen in September was at the 1.764 extension of waves [1] and [2] off the 2018 lows, and the pullback into the November low found its support at the 1.00 extension. With the 151 region being the 2.00 extension off the 2018 lows, this is the one chart that causes me some concern if we do rally that high before this structure off the November low completes.
Therefore, watch the GLD carefully to make sure that the next drop is clearly corrective and not impulsive. As long as the GLD pulls back correctively and remains over the 139-142 support, then remain bullish. Alternatively, a break below 139 would be strong warning.
While I remain bullish for 2020, I will not turn aggressive in the complex until we see the next corrective pullback, followed by a breakout over the high we strike in this current rally.
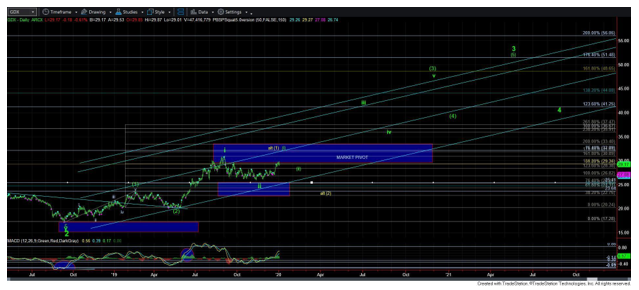
The VanEck Vectors Gold Miners ETF (GDX) and silver do not present in the same way as GLD. Neither have a strong indication of the same negative potential, so are better plays than GLD right now.
Both silver and GDX seem like they need to go a bit higher before they complete a 5-wave structure off the recent lows (see chart below). GDX seems to have the clearest structure, wherein we can count a nice 4th wave as just about having completed on Jan. 2. That would suggest that we can see a 5th wave higher towards the 30.40-31 region before we complete 5 waves off the November low.

Silver leaves me no way to count it in similar fashion to the potential negative implications. In fact, silver counts best as a series of 1’s and 2’s. That would normally suggest that silver can outperform gold if we do trigger the next [1][2] break out scenario.
Leaders/Laggards
Many people believe that if gold leads the metals sector it is positive for the complex, others believe that if silver leads it is positive for the complex, and others believe that if the miners lead it is positive for the complex. Some point to the lagging of one of these charts as being a negative indication for the complex. I am sorry to burst your bubble, but none of these are true.
You see, during a bull phase in the complex, there are going to be times when gold leads, when silver leads, and when the miners lead. None of these are historically reliable indications of the overall health of the complex. History has shown us that they don’t rally alongside each other to the same degrees. Understanding where they are in each of their own structures is what can add alpha to your accounts.
Moreover, in 2011 there was the largest divergence in decades, as silver topped in April while gold continued to rally parabolically for half a year and did not top until September of 2011. If you remained on the sidelines because of the silver action, then you missed $400 of rally in gold (a 27% rally) until it reached the target it had for its chart, whereas silver had reached its target in April.
I suggest reading each chart on its own, rather than betting on commonly propagated market fallacies.
It looks like we are approaching our next local topping point throughout the precious metals complex. Therefore, prudence suggests traders de-risk on the next move higher and wait until the market provide us with a corrective pullback before adding to longs. Should we see that type of structure play out in the coming months, then I would advocate getting aggressive in the metals complex. Until that happens, be cautious and look to protect your portfolio for a pullback.
Originally published on Sat Jan 4 for members of ElliottWaveTrader.net:
Avi Gilburt is a widely followed Elliott Wave analyst and founder of ElliottWaveTrader.net, a live trading room featuring his analysis on the S&P 500, precious metals, oil & USD, plus a team of analysts covering a range of other markets.


