

Several 3D printing stocks have triggered buy signals based on an Inverse Head & Shoulders breakout, reports Suri Duddella.
3D Printing stocks have experienced exponential growth after generating a huge public interest in 2013-2014. After its initial spurt, most of the stocks have lost their value in the subsequent five years as the public started to question its true application and became impatient with their progress.
In the recent months, 3D printing is seeing some resurgence of its interest in 3D Printing metals and biotech/medical industries. This resurgence provides an opportunity for investing in 3D printing companies.
Below is a list of 3D printing and related companies and their performances in 2019.
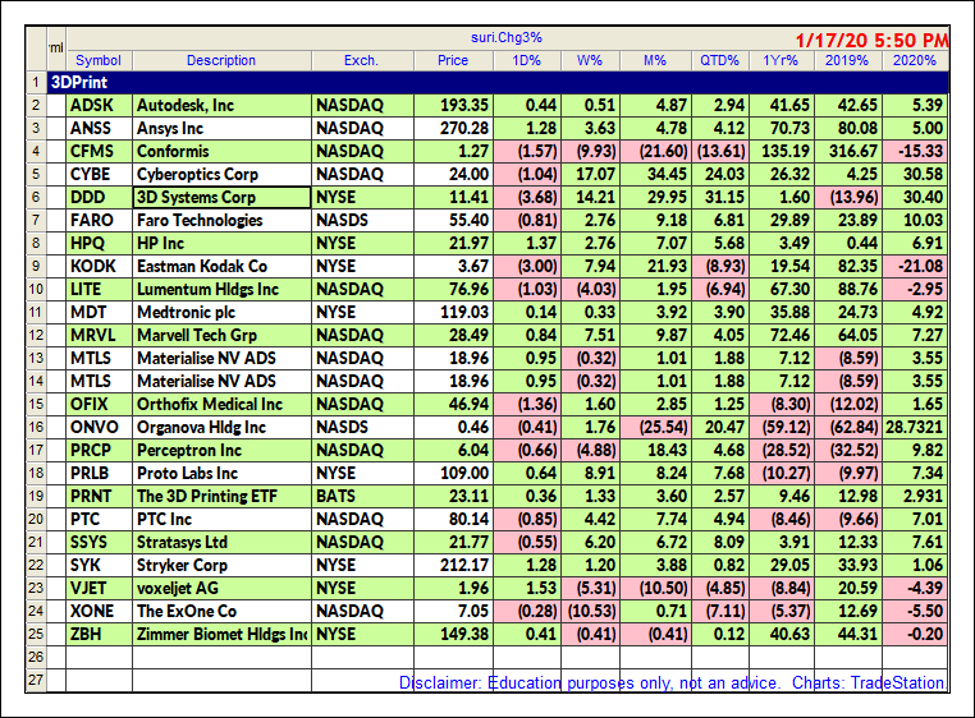
The top five 3D Printing stocks are: 3D Systems Corp. (DDD), Stratasys Ltd. (SSYS), Proto Labs Inc. (PRLB), Voxeljet AG (VJET), ExOne Co. (XONE) and 3D Printing ETF (PRNT). Most of these charts are exhibiting bullish chart patterns and DDD and SSYS are currently trading in an Inverse Head and Shoulders (bullish) pattern. Here is the description of how to trade Inverse Head and Shoulders Pattern.
Inverse Head and Shoulders Pattern
One of the most popular chart patterns in market analysis is the Head and Shoulders pattern. The Head and Shoulders patterns form near market tops in an established sideways to up-trending or bullish markets. Head and Shoulders’ are reversal patterns as they reverse its prior uptrend and follow a bearish or downtrend from its breakdown. These patterns are signified by three successive peaks (tops) resembling two shoulders on both sides and a head in the middle. The head is the largest of the three peaks. An Inverse Head and Shoulders pattern is the head and shoulders pattern upside down (mirror image) and follows a similar structure and trading rules (in reverse). The Inverse Head and Shoulders patterns are also reversal patterns and form in established downtrends.
Trading Inverse Head & Shoulders Pattern
Entry: After right-shoulder formation and pattern completion, if price closes above the neckline with increased volume, enter a long trade above the breakout bar's high.
Stops: 1. Place a stop below the middle of neckline and right shoulder; 2. Place a final stop below the low of the right shoulder.
Targets: Targets are projected from the neckline level. Measure the height of the head and use Fibonacci ratios to compute targets. The first target range is 62% to 79% of the height of the head, and the second target range is 127% to 162% above neckline.
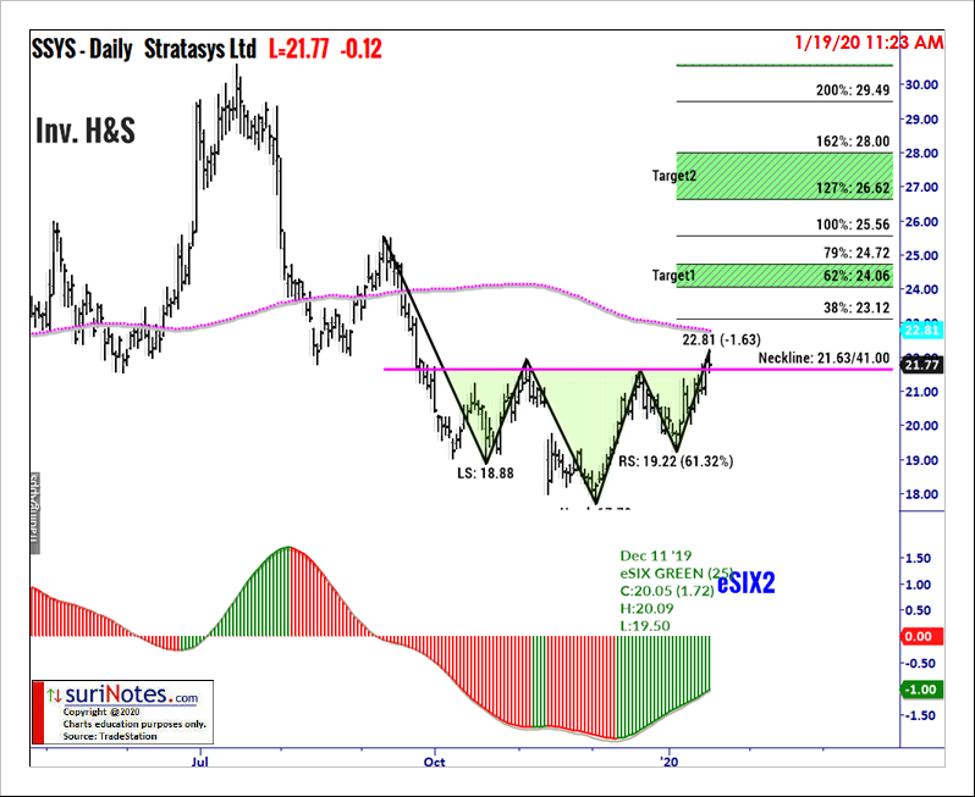
Stratasys Inverse Head and Shoulders Pattern
The following chart shows Stratasys’ daily chart with an Inverse Head and Shoulders pattern formation from September 2019 until now. In January 2020, SSYS started to trade above the pattern's neckline ($21.63) to confirm a potential breakout. A long is entry is entered above $21.75 with a stop below the right shoulders' low ($19.22). Targets are set at $24-$24.75, $25.5, $26.6 to $28.
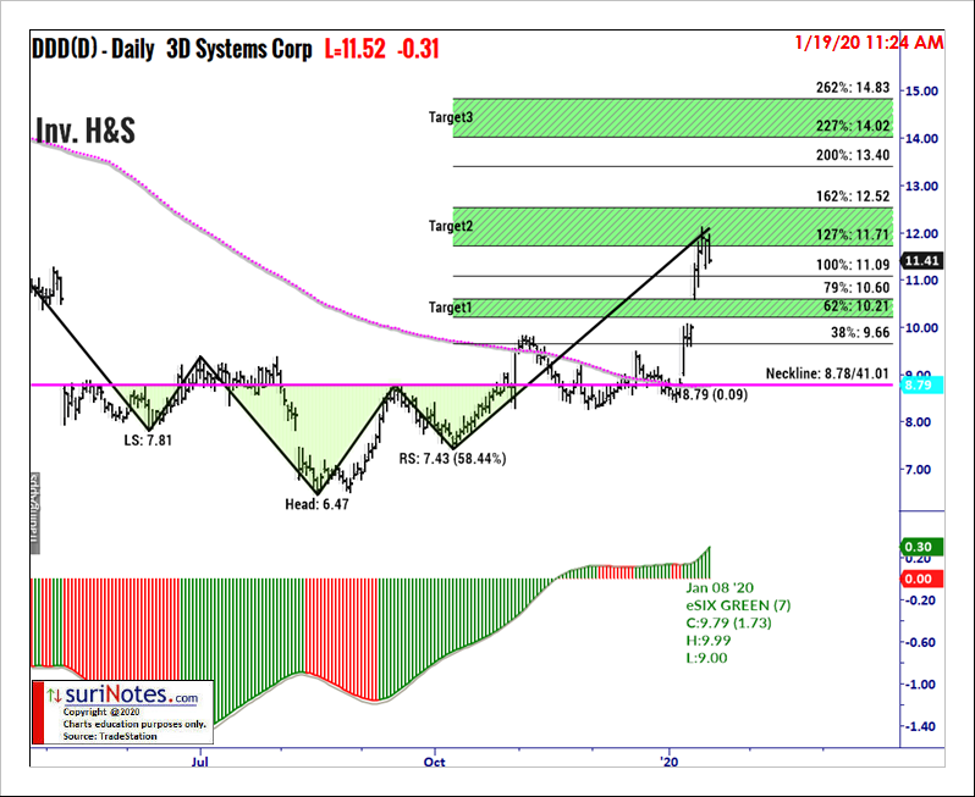
3D Systems
The following chart shows 3D Systems’ daily chart from March 2019 until January 2020 as it formed an Inverse Head and Shoulders pattern. Near the end of October 2019, DDD traded above the pattern’s neckline ($8.78) to confirm a breakout. A long trade was entered at $9 with a stop below the right shoulders' low $7.40 and targets set at $10-10.6, $11.75-12.5, $14-14.83.
Find more of Suri’s work at surinotes.com.


