

The EURUSD Forex market is trying to resume itstwo-year bear trend, writes Al Brooks.
The EURUSD Forex market is trying to resume its two-yearbear trend, but there will be buyers below the November and October lows.
The weekly euro chart formed a bear inside bar last week(see below). It closed on its low and it followed three consecutive bear bars.This was a credible Low 1 sell setup. When this week traded below last week’slow, it triggered the sell signal. The bears are hoping that the two-year beartrend is resuming after a three-month rally to the top of the bear channel.
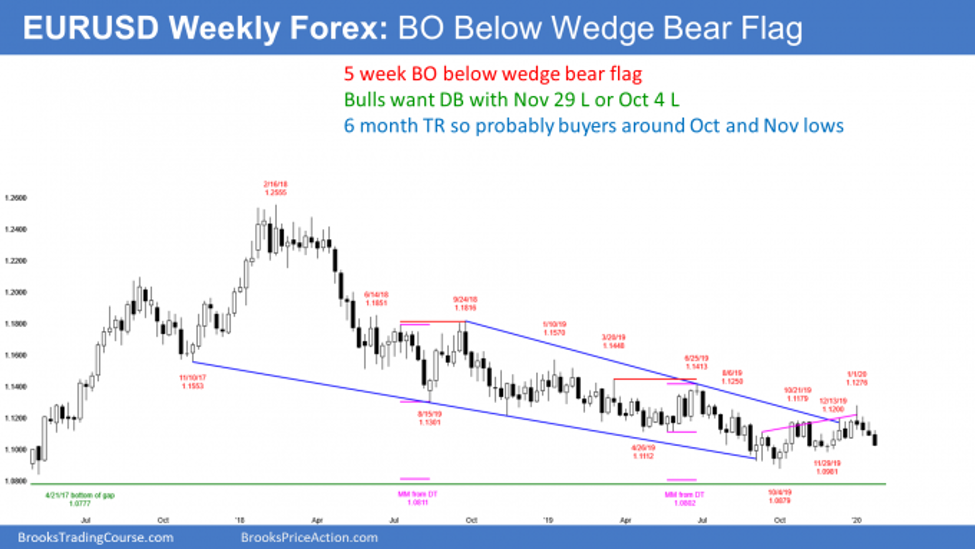
However, the EURUSD is also in the middle of a six-monthtrading range. Traders have been looking for reversals every few weeks. Sincethis is the fourth week down, there are fewer bears willing to sell. Instead,they would rather begin to look to take profits and sell again after a two- tothree-week bounce.
EURUSD monthly Forex chart: Low 1 bear flag
The January candlestick on the monthly chart closes in fivetrading days (see below). So far, January is a big bear bar closing near itslow. It traded above the December high and is now near the December low. If itfalls below the December low next week, January would be an outside downcandlestick on the monthly chart in a two-year bear trend. That would increasethe chance of lower prices.
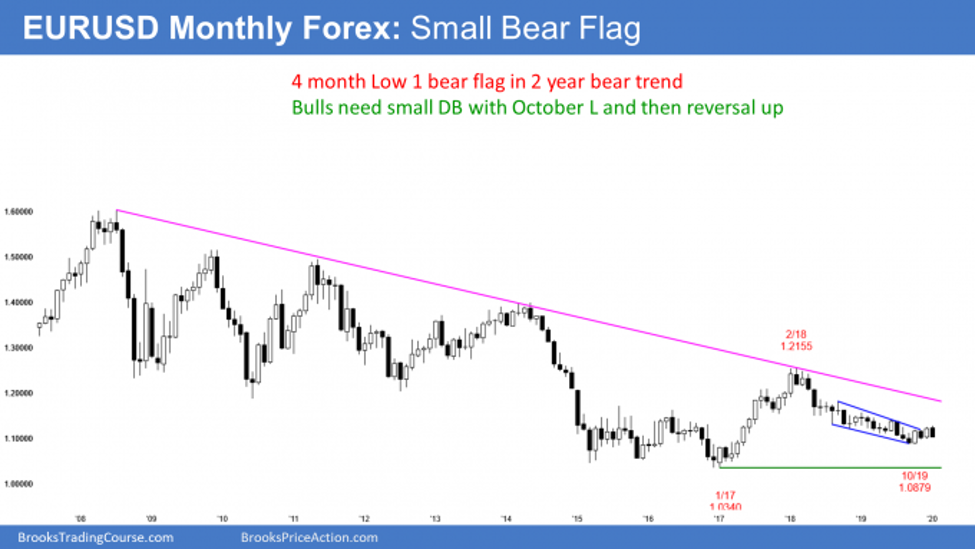
I have not mentioned the two measured move targets and thegap around 1.08 on the daily chart recently (not shown). However, both aremagnets below. An outside down month would increase the chance of the trendcontinuing down to that area.
While this is true, the past six months have been sideways.They therefore have formed a tight trading range. That is a bad environment forstop entry traders.
January is therefore a weak sell setup, even though themonthly chart has been trending down for two years. There may be more buyersthan sellers below the January low.
Traders have been buying every new low for 20 months.Therefore, there probably will be buyers below the October low, which is thebottom of the bear trend, and around the 1.08 magnets. The odds favor moresideways to down trading until the bulls get a strong upside breakout.
Trading Room
Traders can see the end of the day bar-by-bar price action report by signing up forfree at BrooksPriceAction.com. I talk about the detailed E-mini price actionreal-time throughout the day in the BrooksPriceAction.com trading room. We offer a two-dayfree trial.


