

Tesla’s recent run has been impressive and begs the question: When will it end, notes Matt Weller.
There are certainly financial topics impacting more individuals and bigger companies, but there’s arguably nothing more fascinating happening in markets than the parabolic explosion taking place in shares of Tesla (TSLA).
Tesla CEO Elon Musk’s provocative electronic car company is perpetually creating headlines, but the even against that backdrop, the stock’s surge is still astounding (see chart below).
Below, we highlight a couple of the most fascinating statistics on the move:
- Tesla is trading up 115% year-to-date, 271% from the Cybertruck “bricked launch” in late November, and 400% from the low set last June.
- At over $160 billion, Tesla has a higher market capitalization than rivals General Motors (GM), Ford (F), Fiat Chrysler (FCAU), and Daimler (DAI) combined!
- After Tuesday’s surge, Tesla (-$862M in “profit” last year) market capitalization has exceeded that of McDonalds ($6 billion in profit last year) and Nike ($17.4 billion in profit last year).
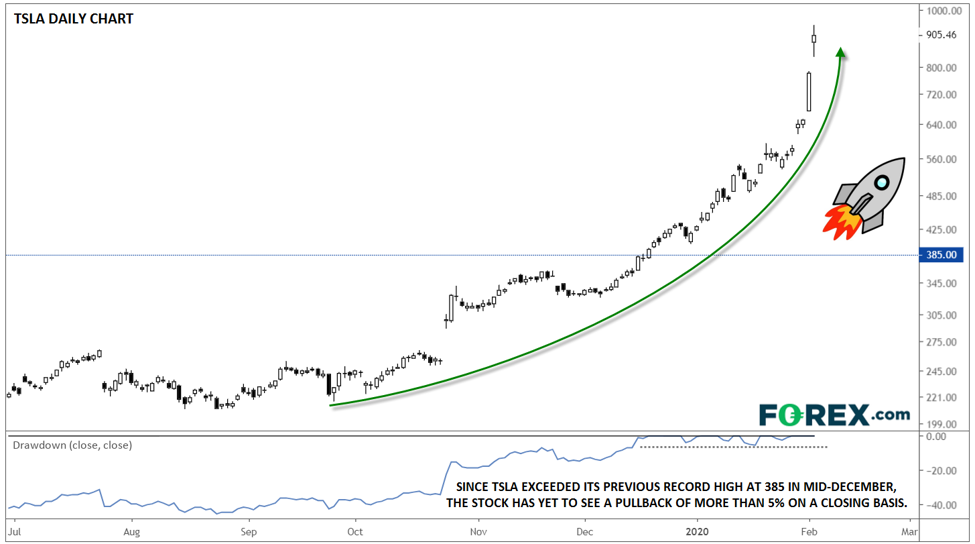
Source: TradingView, GAIN Capital.
So, what’s driving the surge?
At the most basic level, the situation is a textbook “short squeeze,” albeit on an unprecedented scale. Midway through last year, approximately 25% of Tesla’s shares outstanding were sold short, meaning that traders were betting that they’d go down. As prices began to rise, some of those traders were forced to close their short positions and buy the stock back. This in turn pushed prices up further, forcing more short sellers to buy the stock, pushing prices to rise yet further and so on.
With any parabolic market move, the question isn’t whether it’s reasonable, but where it will stop. After all, in the words of the great John Maynard Keynes, “markets can stay irrational longer than you can stay solvent.” As of writing, 13% of shares are still held short, so there’s still plenty of fuel for further gains, even if the stock ultimately settles lower than current levels.
During this type of sentiment- and positioning-driven move, traditional forms of technical and fundamental analysis tend to lose their effectiveness, but one signal we’ll be watching for a sign that the rally is ready to reverse is the peak-to-trough drawdown. Since Tesla eclipsed its previous record high and started the true parabolic phase of its rally in mid-December, the stock hasn’t seen a peak-to-trough drawdown greater than 5% on a closing basis.
Accordingly, when TSLA does see a closing drawdown of greater than 5%, it will represent a change in the character of the move, whether that occurs later today or after the stock surges to $2,000. At that point, bears could have more confidence that a sustainable reversion to more sensible levels may be at hand. While this methodology is far from foolproof or guaranteed, it can help bullish traders limit their risk and allow bearish traders to potentially put the odds in their favor.
Hear what Matt Well had to say about Geopolitics, Economics and the Forex Markets at the recent Las Vegas TradersExpo. Matt Weller | Global Head of Market Research | GAIN Capital mweller@gaincapital.com | w: www.forex.com & www.cityindex.co.uk


