

After a brief minor drawdown, the bulls have regained control of the stock market, reports Kerry Given.
One week ago, Friday, Jan. 31, we watched the S&P 500 Index (SPX) close down 58 points at 3226. As it turned out, that was the low of the recent pullbacks. SPX corrected by 3.2% and began its recovery this past Monday. SPX had fully recovered all of the previous week’s losses by the close on Wednesday at 3335. The S&P 500 index traded a bit higher on Thursday and then declined modestly on Friday to close at 3328, up 2.8% for the week.
Trading volume ran above the 50-day moving average most of the week, but steadily declined and dropped below the 50-day on Friday. Strong trading volume is a reinforcing signal for whatever market action is observed, whether higher or lower. The bulls were clearly in charge Monday through Wednesday, as the market gapped open higher each morning, and trading volume gained each day. As the market weakened on Thursday and Friday, volume declined (see chart below).
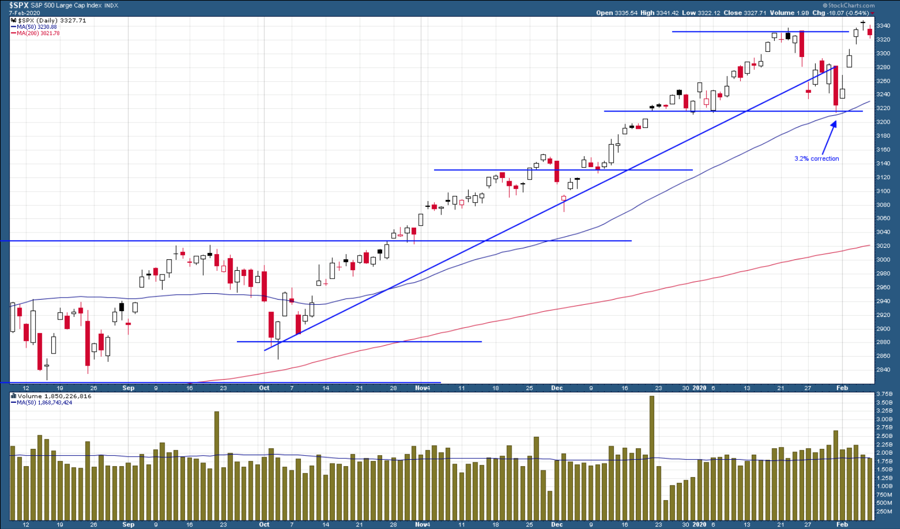
Standard and Poor’s 500 Index (SPX)
Chart courtesy of StockCharts.com
We have seen pullbacks hitting temporary lows on Jan. 27 and Jan. 31, but the S&P 500 index is now back to the highs set earlier in January.
I have drawn the Bollinger bands on the SPX chart below with two standard deviations above and below the 20-day moving average. SPX completed the round trip from the upper edge of the Bollinger bands to the lower edge in eight trading sessions, but only required four trading sessions to return to the upper edge of the bands (see chart below). This was another demonstration of the bullish support for this market.
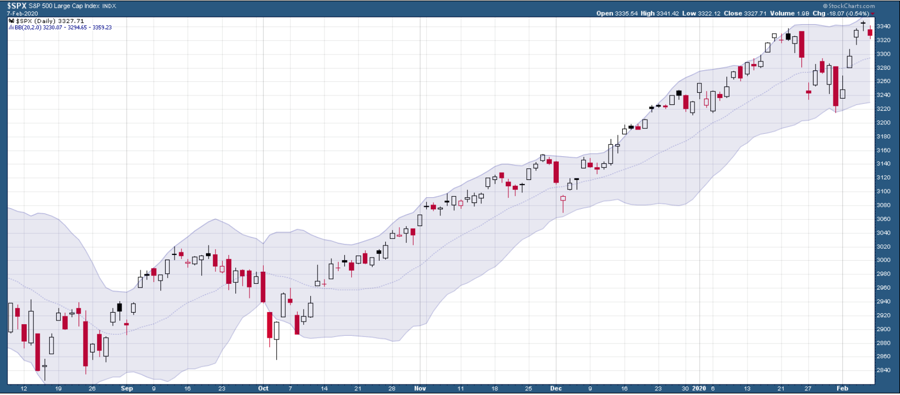
SPX with Bollinger Bands
Chart courtesy of StockCharts.com
The Cboe Volatility Index (VIX), which tracks implied volatility on the S&P 500 options, opened the week at 18.6 and closed Friday at 15.5. Even as the market set new highs on Wednesday, VIX remained at 15.2. I personally regard 15 as the borderline level of volatility. When market volatility hits 15, I start to pay closer attention and be more cautious. The Coronavirus scare is still on traders’ minds.
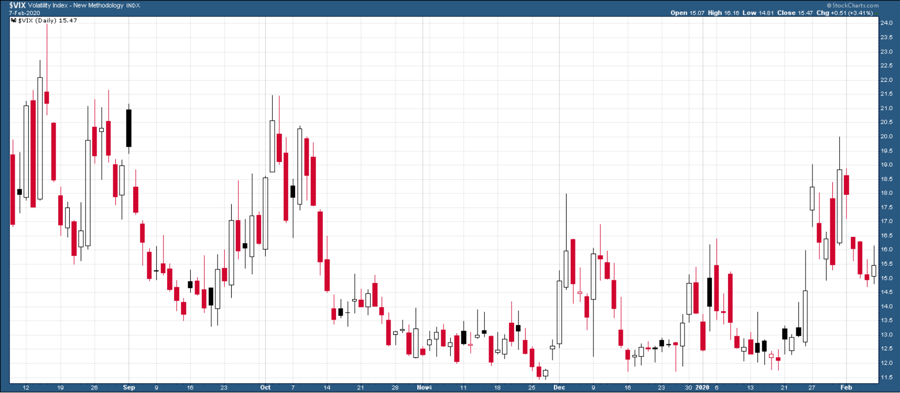
CBOE SPX Volatility Index (VIX)
Chart courtesy of StockCharts.com
The iShares Russell 2000 ETF (IWM) traded even more strongly than SPX as the market recovered, but it also accentuated the turn in sentiment on Thursday and Friday, gapping lower at the open on Friday and closing at 164.88. However, IWM remained up 2% for the week. IWM’s weakness shows us that we are not yet out of the woods (see chart).
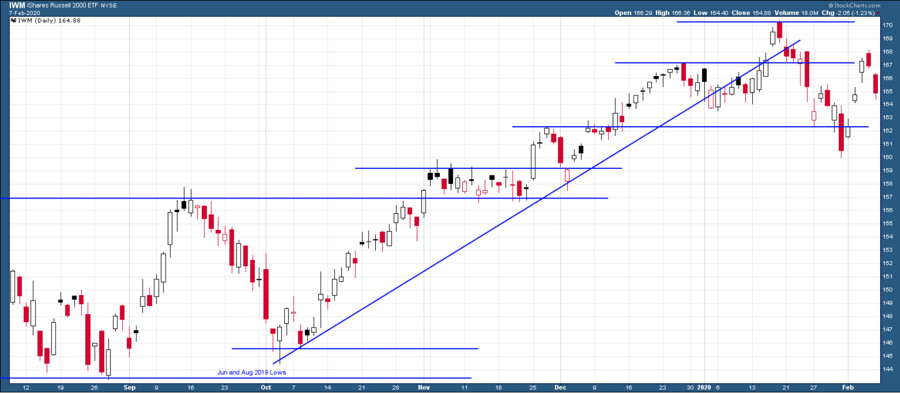
IWM Exchange Traded Fund (ETF)
Chart courtesy of StockCharts.com
The Nasdaq Composite index closed Friday at 9521, up 330 points or 3.6% for the week (see chart below). Nasdaq outperformed SPX once again this week, reflecting the strong performance of high-tech stocks like Apple (AAPL) and Amazon (AMZN).
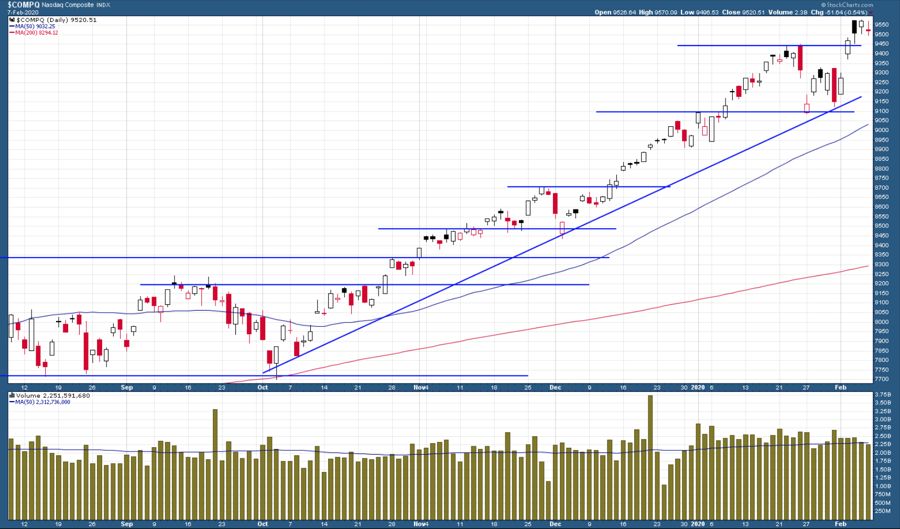
NASDAQ Composite Index
Chart courtesy of StockCharts.com
Nasdaq’s trading volume matched the pattern we saw in the S&P 500 companies, running above the 50-day moving average through Wednesday, but declining to complete the week at below average volume levels.
Each day brings new reports of Coronavirus cases around the world. There are now 12 confirmed cases of Coronavirus infections in the United States. One encouraging statistic is that the current number of deaths in China as a percentage of the number of confirmed infections is lower than what was observed during the SARS outbreak in 2003.
The markets continue to be affected as traders fall prey to the alarmist news reports.
The driving forces behind this exceptional bull market remain valid:
- Two major trade agreements signed.
- Continuing strong economic data, including record low unemployment, and wage growth.
- FOMC remains committed to low interest rates for the near future.
- Earnings and revenue growth in this earnings announcement cycle have been very strong.
My trading posture is unchanged. I describe it as cautiously bullish.


