

The euro currency is in a sell climax, it could test par but may reverse first, writes Al Brooks.
The euro FX currency pair (EURUSD) is in a sell climax. A two-week short covering rally will probably begin within a week or two.
The EURUSD has sold off strongly for the past two weeks (see chart). It broke below the October low, which was both the bottom of the two-year bear trend and the six-month trading range.
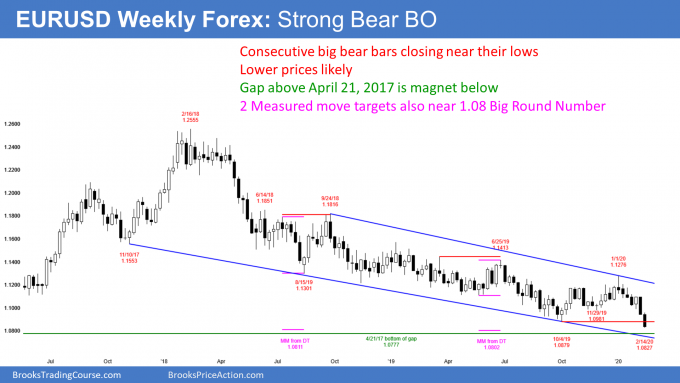
April 2017 gap at 1.0777 is magnet below
For six months, I have targeted 1.08 as an important price magnet. The biggest reason is that there is a gap above the April 7, 2017 high of 1.0777 on the daily and weekly charts.
Open gaps are rare in the Forex market. Most gaps close. The EURUSD is now near enough to this gap to make it likely that it will test the gap and probably close it. But because the daily chart is so oversold, there will probably be a bounce first.
There are other magnets around that gap; 1.08 is a Big Round Number and therefore a magnet. In addition, there were a couple double top bear flags over the past two years with measured move targets around 1.08.
EURUSD to test 2017 bottom? Par?
Will the selloff continue down to below the January 2017 low of 1.0340? That was the start of a strong bull trend. The bulls want to keep this selloff from falling below that low. They would then view this selloff as just a deep bull flag pullback from the rally to February 2018.
The bears, however, not only want a break below the bull trend low, they want the EURUSD to fall to par (1.0000). The momentum down on the weekly chart is strong enough to get there. But trends resist change. Therefore, it is still more likely that the two-year selloff will end before falling below the 2017 start of the bull trend.
And even if it falls below, it would then be at the bottom of a six-year trading range. That will likely result in many months of sideways trading or even a reversal up.
Daily chart should bounce soon
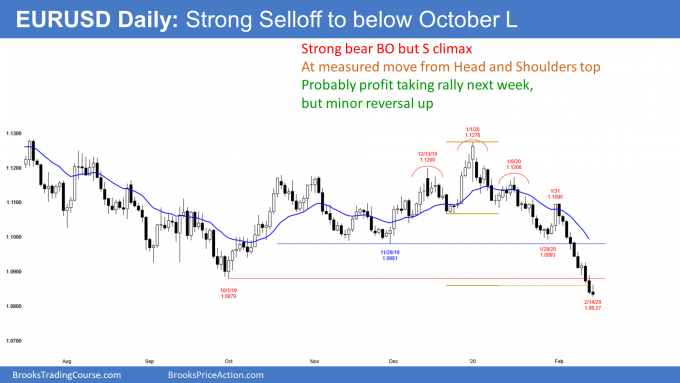
The daily chart has been in an unusually strong bear breakout for two weeks (see below). However, it is important to note that the bulls formed a small bull reversal bar on Tuesday. While that might seem insignificant, it was a sign of early profit-taking.
When there is a bull bar in an extreme sell climax and then the selling resumes, there is usually a second attempt to reverse up within a few bars. The bears will more aggressively take profits (short-covering) after that second attempt. The bulls will buy as well.
Friday was a bear doji bar and a possible candidate for that second attempt. However, most traders want to see a big bull bar closing on its high before they become confident that the bounce has begun. The selloff will probably continue at least a little more before the short covering rally begins.
After the bears take profits, they will not look to sell again just a few days later. If that was their plan, they would not have taken profits.
Once they take profits in an extreme sell climax, they know there is an increased risk of a reversal up into a bull trend. But traders also understand that the first reversal up is typically minor. They want to see some kind of double bottom before concluding that the trend has reversed.
The bears usually allow the bulls to make at least a couple attempts to create a bull trend reversal. If the bears sense that the bulls are failing twice, the bears begin to sell again. Therefore, a profit-taking rally after an extreme sell climax usually has at least two legs up and lasts about 10 or more bars.
Double bottom with October low
The bulls hope that this selloff is just a sell vacuum test of the October low. They want a rally up from here. That would then be a lower low double bottom. Friday is a weak buy signal bar and the context is reasonable. The short covering rally might be underway, but most traders want to see one or more big bull bars closing on their highs.
The bulls want a violent reversal up, similar to the one in the stock market after the Christmas 2018 crash. However, that rarely happens. The first reversal up from a sell climax is typically minor.
Because this sell climax is extreme, the short covering could last a couple weeks. The bears typically sell again near some resistance. At a minimum, they would then expect a test of the low.
If the bulls then get a second reversal up, that would be a double bottom with the sell climax low. They would then have a better chance of a bigger reversal up. Right now, the best they probably can get is a couple weeks of short covering, and then a test down or a resumption of the bear trend.
How far will a short-covering rally go?
A short covering rally typically reaches some resistance level, like the 20-day exponential moving average or a breakout point. A break below a major support level like the October low usually soon has a pullback to above that low. The next higher breakout point is the November low, which is just below the 1.10 Big Round Number.
Traders should expect a short covering rally to begin within a few days. It might have started on Friday, but most traders want to see a big bull bar before they become confident of a bounce.
Sometimes it results in the EURUSD going sideways for a week or two. But since this selling is so extreme and there are magnets about 150 pips above, the bear rally will probably go up to the 20-day exponential moving average and maybe the November low.
Can this selloff continue down to par without more than a two- to three-day bounce? That would be unusual. Traders expect a short-covering rally to begin within the next week or so.
Trading Room
Traders can see the end of the day bar-by-bar price action report by signing up for free at BrooksPriceAction.com. I talk about the detailed E-mini price action real-time throughout the day in the BrooksPriceAction.com trading room. We offer a two-day free trial.


