

While the U.S. 30-year Treasury bond rallied near to its all-time high, this could signal a double top reversal pattern, writes Al Brooks.
The U.S. 30-year Treasury bond futures has rallied in February to near the August all-time high. However, the rally comes after four consecutive bear bars on the monthly chart (not shown). When that is the case, there is usually at least a small second leg sideways to down.
On the weekly chart (below), the rally from the Jan. 2 low now has three legs up. It is therefore a wedge. A wedge tends to attract profit takers. This is especially true when the wedge rally is testing a prior high. The second leg up in a double top often is a wedge.
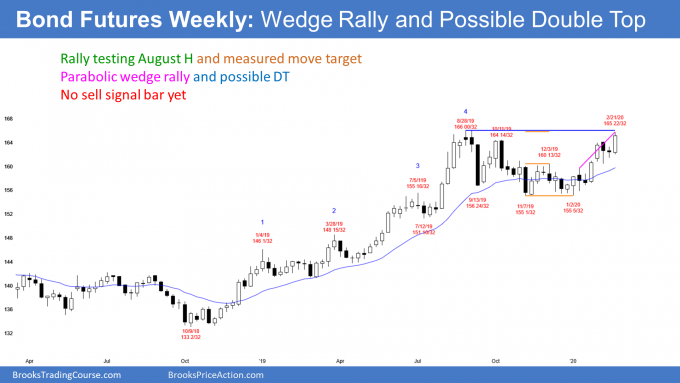
There is no top yet. Also, last week closed near its high. Finally, the third leg up in the wedge could easily go several points above the top of the second leg before there is a reversal down. Consequently, long bond futures will probably go at least a little higher. But because of the wedge and the top of a seven-month range, probably not much higher before there is at least a minor reversal down.
Trading Room
Traders can see the end of the day bar-by-bar price action report by signing up for free at BrooksPriceAction.com. I talk about the detailed E-mini price action real-time throughout the day in the BrooksPriceAction.com trading room. We offer a two-day free trial.


