

Crude oil, the U.S. and Canadian dollars and the Coronavirus—Joe Perry reports.
The U.S./Canadian dollar pair (USD/CAD) put in a four-month high Wednesday near 1.3333 as crude oil is trading at its lowest levels in 13 months, with front month crude futures well below $50. Canada is an oil lead exporting country. As the Coronavirus continues to spread throughout the world (today, 83 cases being monitored in Nassau County near New York City), the expectations continue to be that the demand for crude oil will be lower.
As expectations for demand fall, so does the price of oil. As such, when the price of crude oil falls, so does that value of the Canadian dollar. The daily chart of Crude Oil below, the current correlation coefficient is -.81 (which is actually off the lows from last week of near -1.00!)
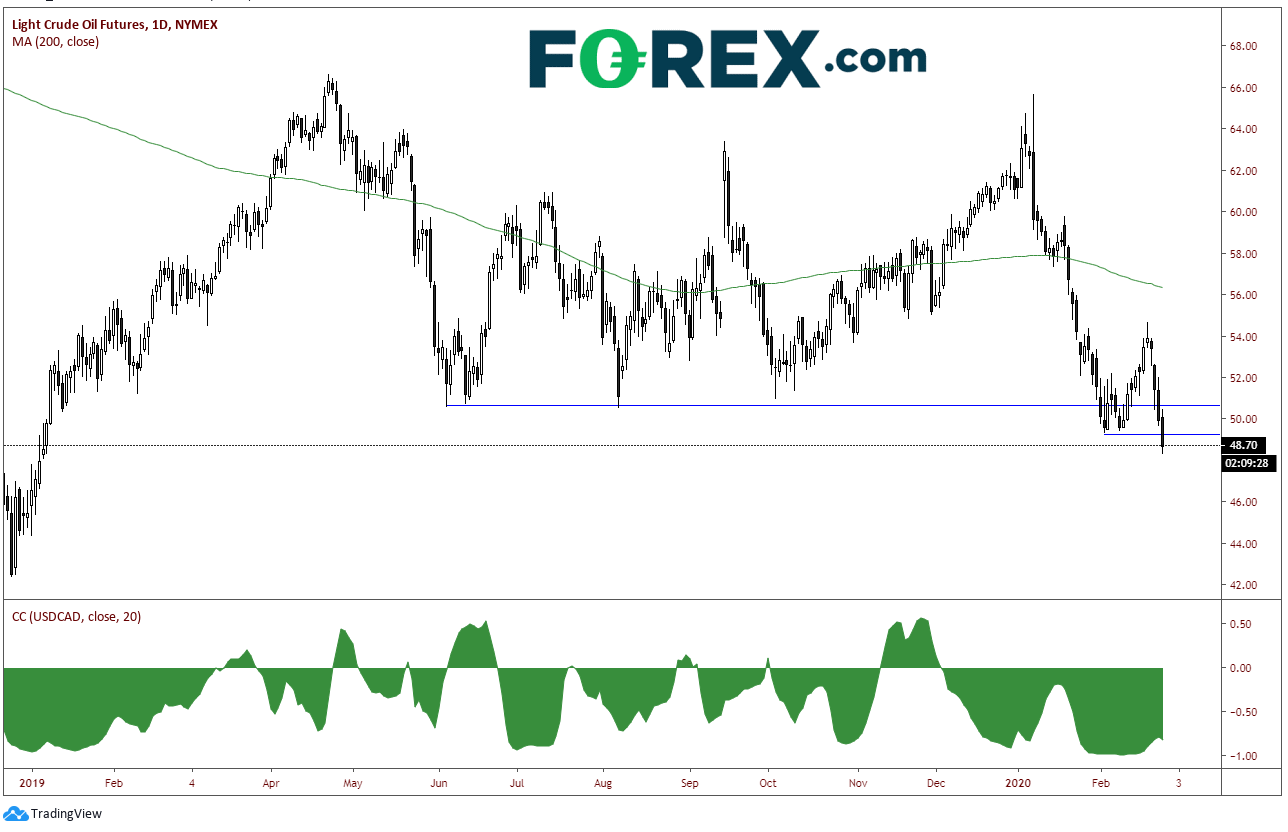
Source: Tradingview, NYMEX, FOREX.com
Next week, on March 4, the Bank of Canada will meet again to discuss interest rates. The BOC has left rates unchanged since 2018 at 1.75% At their last meeting, they took a slightly more dovish stance and said that they would closely monitor the economy and the recent global growth slowdown. That meeting was on Jan. 22. Although current expectations are for the BOC to remain on hold once again, a lot has changed since their last meeting when crude oil was at $56.74. Phase One of the US-China Trade Deal was just signed a week earlier, and there wasn’t any talk of the Coronavirus. Look how much can change in six weeks — they will have much to discuss!
USD/CAD has been in a symmetrical triangle since early 2016. At the end of 2019, price broke below the bottom, upward sloping trendline of the triangle (which dates back to 2012) and tested 1.3000. Price briefly traded into the 1.29 handle and bounced back into the apex of the triangle.
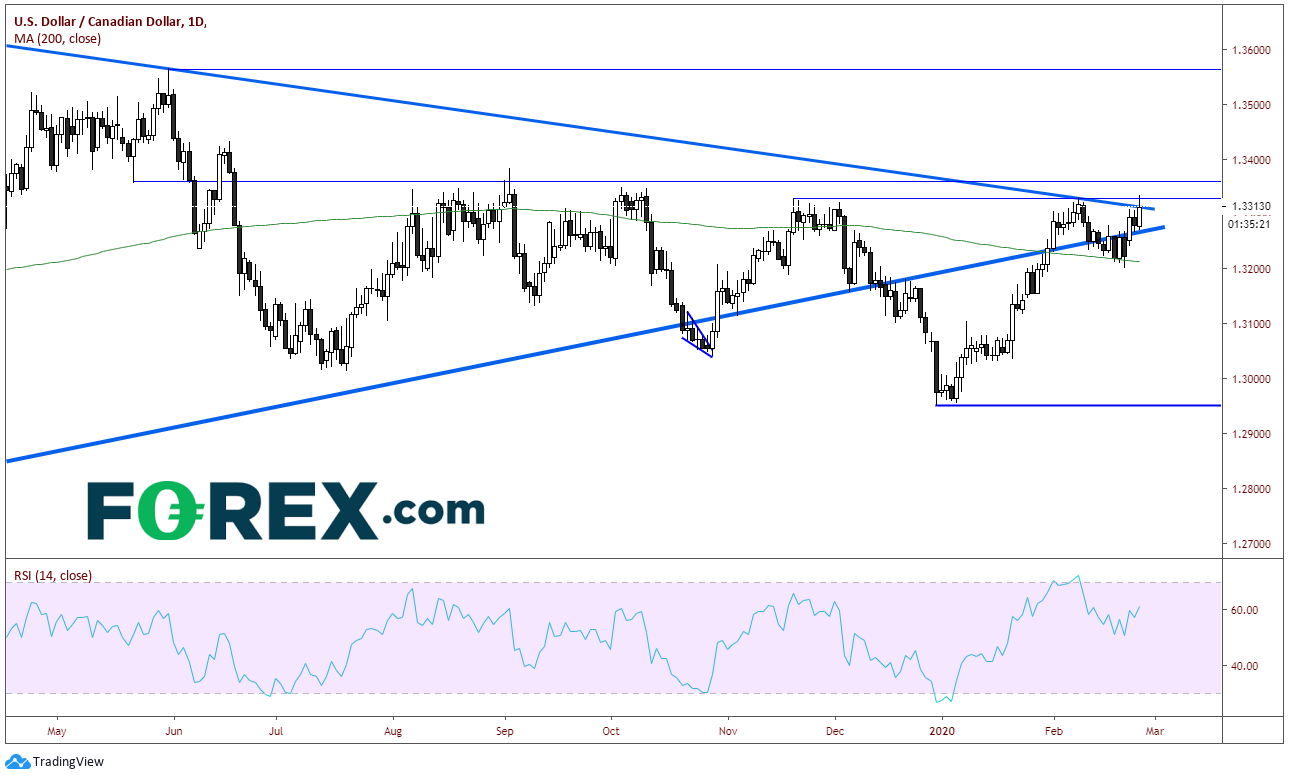
Source: Tradingview, FOREX.com
Notice on the 240-minute chart what happened at the last BOC meeting, when they turned from neutral to dovish. If they are even more dovish, price may continue higher. If price can close above current levels, there is horizonal resistance above at 1.3357. After that is the 127.2% Fibonacci extension from the highs on November 20th, 2019 to the lows on December 31st, at 1.3432. Above that is the 161.8% Fibonacci extension from the same time period which comes in at 1.3560. This also coincides with a previous peak in May of last year (on daily timeframe). Fist support is at Wednesday’s lows of 1.3271. Below that, Friday’s lows near 1.3200 and then the highs on the move after the BOC meeting on Jan. 22 near 1.3150.
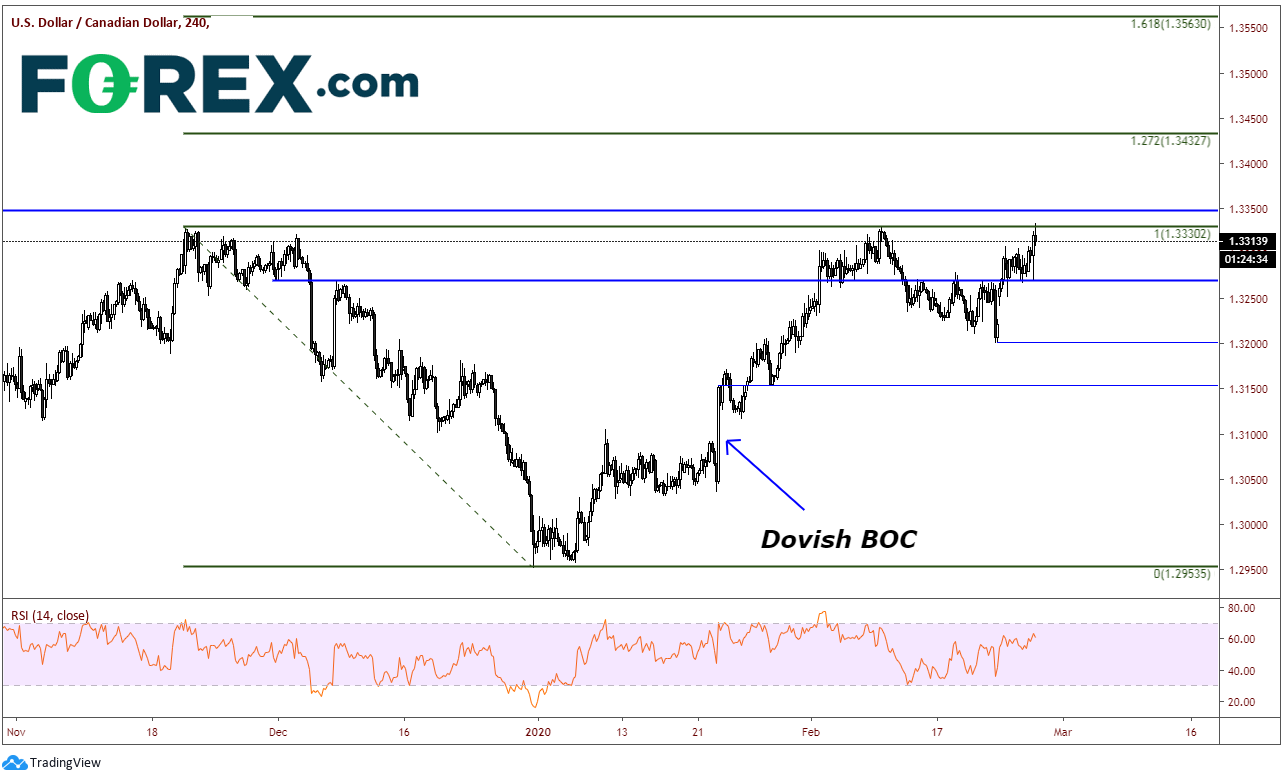
Source: Tradingview, FOREX.com
If crude does continue to move lower, one can expect USD/CAD to continue moving higher. In addition, if the BOC continues to be dovish at its interest rate decision meeting next week, USD/CAD also may continue higher. However, if crude starts to bounce (perhaps a relief bounce in the short term), USD/CAD could pull back, which may give traders another chance to buy before the BOC meeting.
Joe Perry holds the Chartered Market Technician (CMT) designation and has 20 years of experience in the FX and commodities arenas. Perry uses a combination of technical, macro, and fundamental analysis to provide market insights. He traded spot market FX and commodity futures for 17 years at SAC Capital Advisors and Point 72 Asset Management.


